
A Highland Fling (Part 2): Learning from LiDAR
The Field Methods class finished our late Winter/early Spring fieldwork at William & Mary’s Highland in March. Over the course of four field excursions, we put in ~530 people hours at Highland – learning to do science in the field and ultimately collecting data on vegetation, soils, water, and rocks (of course).
Since Spring Break, we’ve completed draft geologic maps and, in small groups, are working on specific research projects. On April 28th, we’ll present our findings and move that content to a class website.
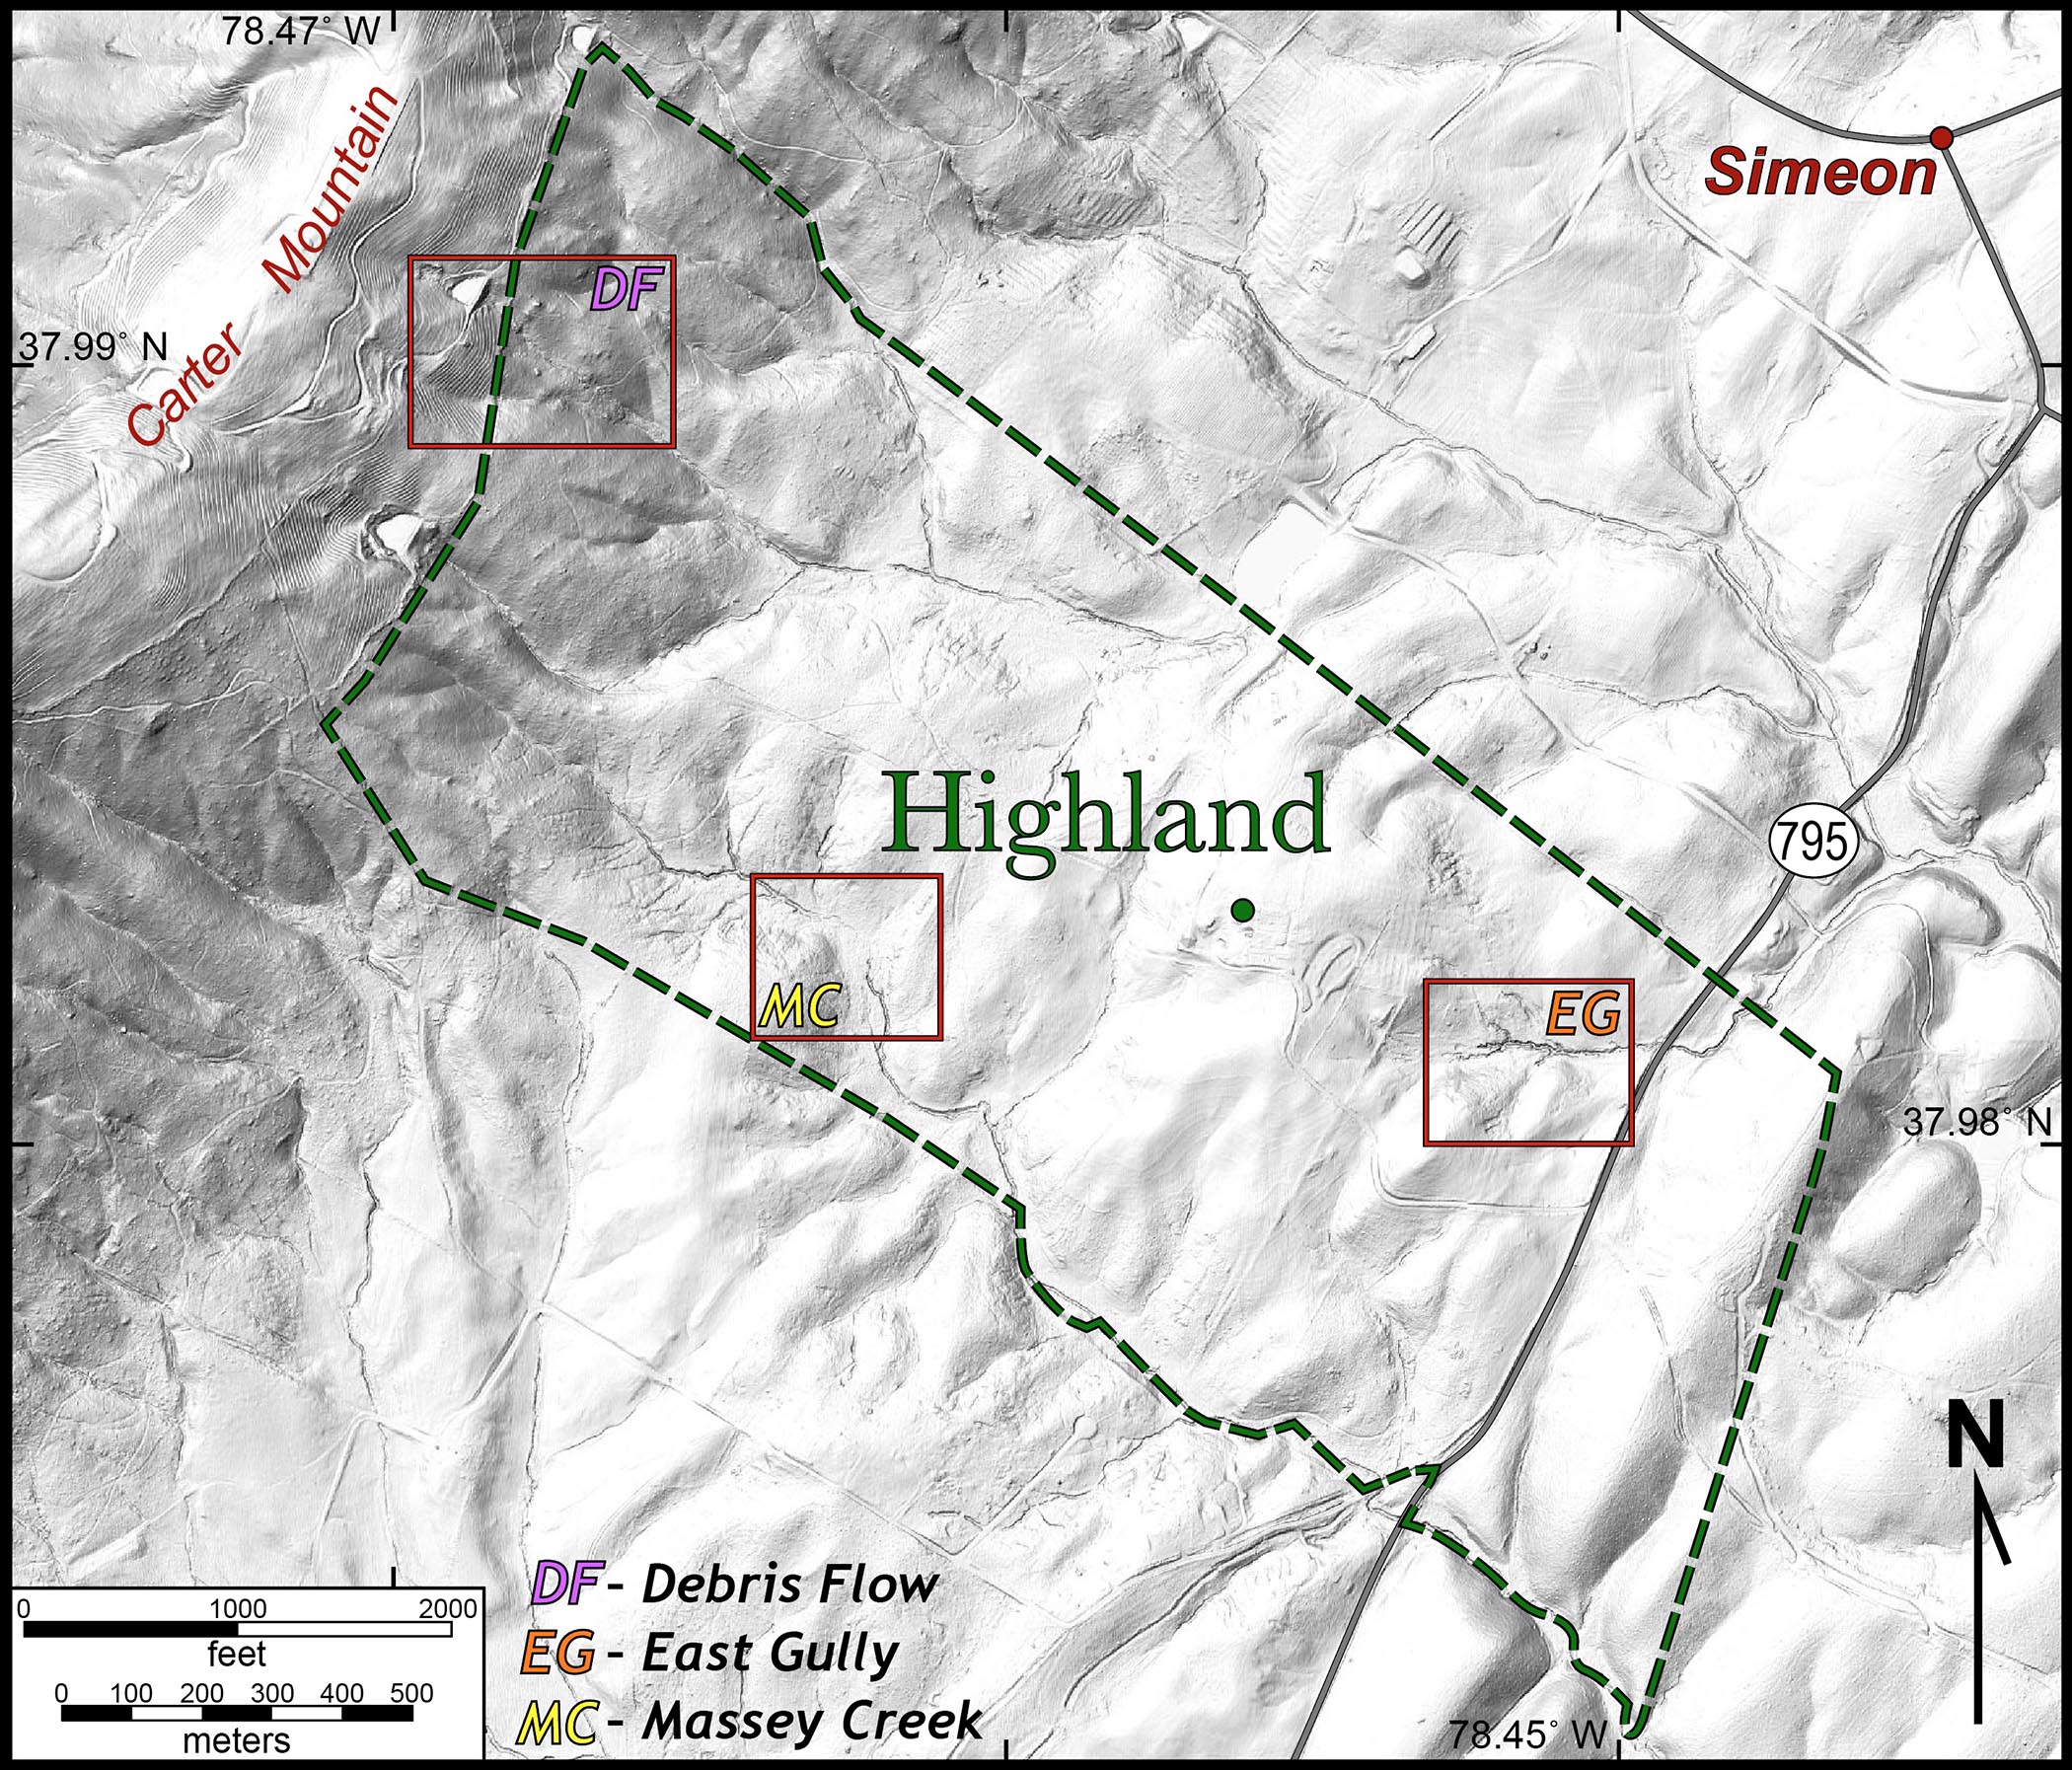
Shaded relief map of William & Mary’s Highland and the surrounding area (from LiDAR topographic data). The small red boxes are detailed maps that are illustrated below.
In this post, we discuss some of what we’ve learned using LiDAR (Light Detection And Ranging) topographic data from Highland. These data were collected by the Commonwealth of Virginia in 2016/17 and are publicly available, although the learning curve for data processing is not trivial.
We use the bare earth LiDAR data which effectively strips away vegetation such that the Earth’s surface features are quite evident. Our dataset has a 0.0278” (second) resolution, which translates to individual pixels ~1 meter (3’) on a side with an elevational accuracy of ~10 cm (~4”) enabling us to build high-resolution digital maps of the Highland terrain.
The movie below is a rotating 360˚ digital panorama that’s centered on Highland, its perspective is from an oblique vantage point ~1500 meters (4000’) above the terrain. I could watch this movie all day, as the texture and topography of the landscape almost jump out from the screen. The Highland property extends from the slopes of Carter Mountain eastward to a set of low linear ridges. The topographic grain trends in a northeast-southwest direction– why might that be? The fine-scale texture of the surface (pasture or a vineyard or a pine stand) is also evident.
The detailed map below is a shaded relief map that employs both oblique directional and hill slope shading to bring out landscape features. We obliquely illuminated the digital landscape from the northwest, such that slopes facing to the northwest are bright while slopes facing to the southeast are in varying degrees of shadow. The hill slope shade makes steep areas darker and flat areas brighter. Collectively, this combination of shading, on this mostly southeast facing slope, yields the ‘brooding shade’ because of its high contrast and dark overtones. But this style of shading also makes many landforms pop!
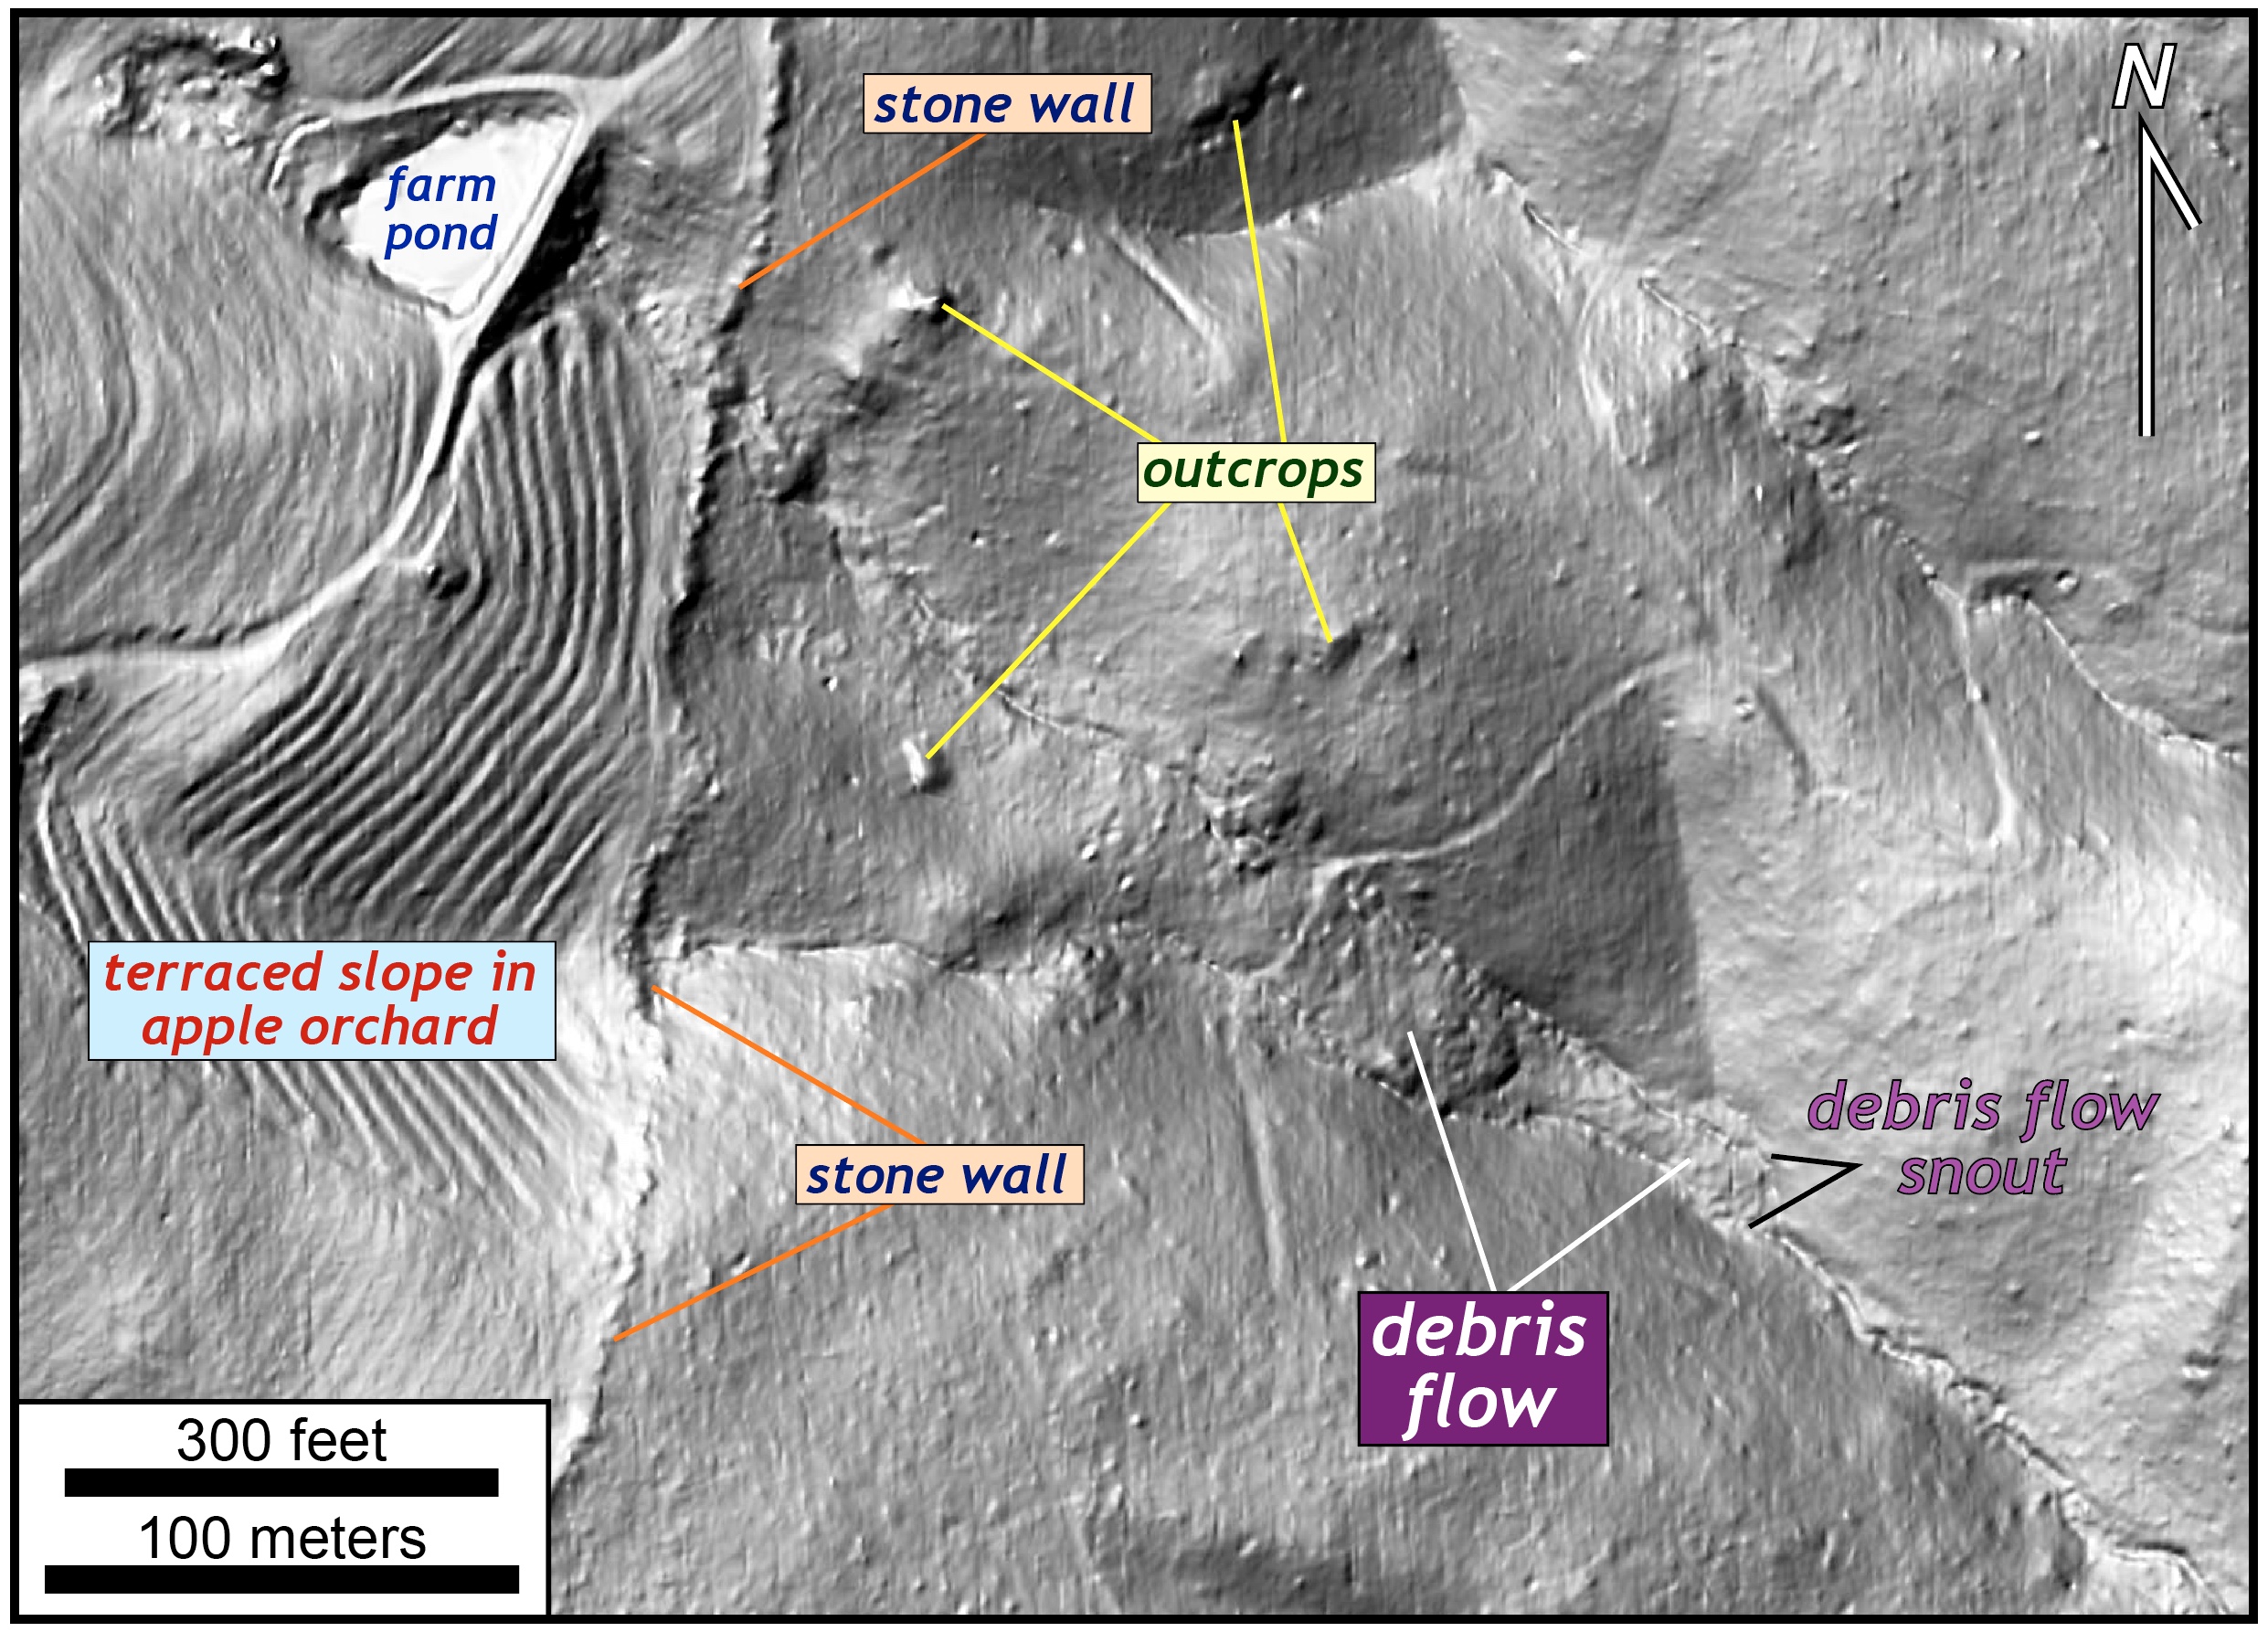
Brooding hill shade image on the southeastern side of Carter Mountain. Note the many landscape details.
In this map, the terraced slopes of the orchard on Carter Mountain are quite apparent, as is the massive stone wall that separates the orchard property from Highland. We hypothesize that when the terracing for the orchard took place, rocks were removed and piled up along the property line. Shading also reveals large natural outcrops of the underlying bedrock – during our geological mapping these were features of interest.
In the steep valley below the farm pond, we’ve identified a landslide deposit, likely a debris flow as it’s got the characteristic form that indicates earth materials moved downslope in mass. We’ve verified this interpretation with field observations – the base of the deposit has a bouldery snout while higher up in the valley there are low scarps created as the mass movement eroded down to bedrock. We’ve characterized the geometry of this deposit, but we don’t know the age of this mass movement event. Was it a historic event (within the past 2 or 3 centuries) or pre-historic movement (thousands of years old)?
The eastern side of the Highland property is dominated by large pastures both to the north and south of the graceful ash-lined entrance road. The North Pasture is interspersed with patches of woodland. The largest of these woodlands hides an extensive gully system that is beautifully revealed on the LiDAR imagery. How did these erosional gullies come to be? In spots, the gully is 3 meters (10’) deep, you could lose a cow in there!
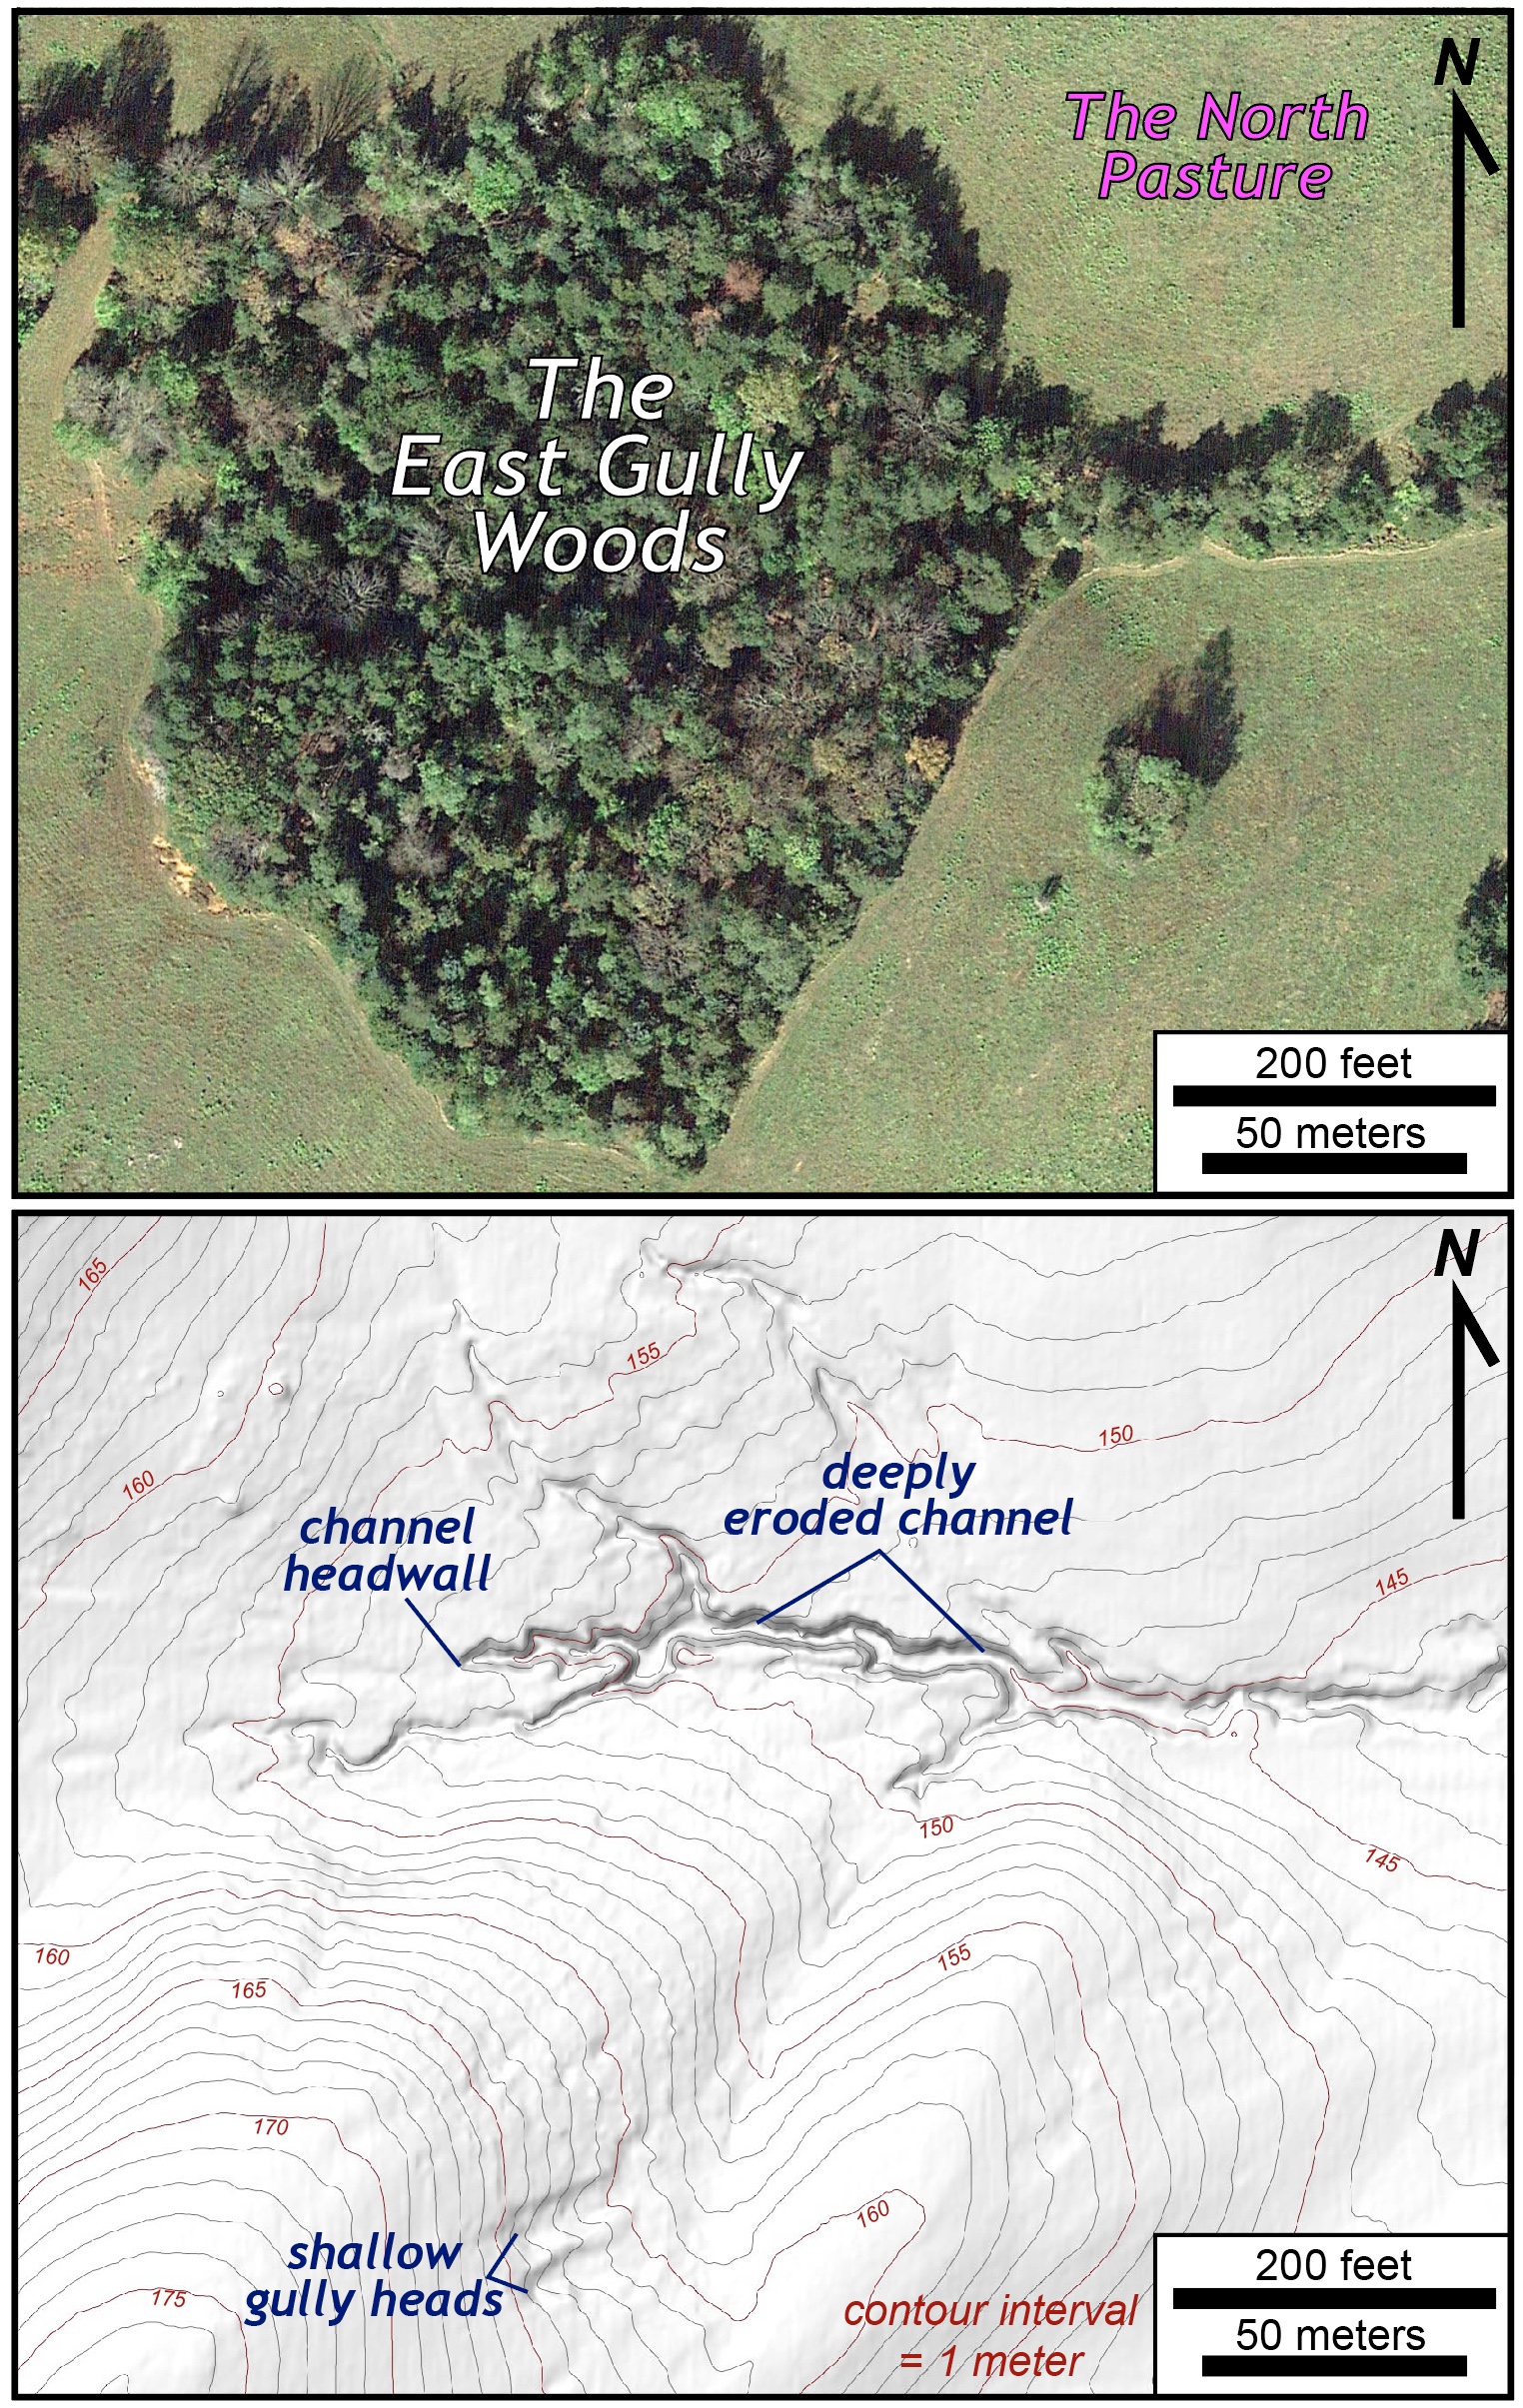
The East Gully. Top- Google earth imagery. Bottom- LiDAR derived 1-meter contour map.
It’s likely that the gullies were created by poor land use management, perhaps from over grazing by livestock or careless soil tillage, which caused extensive runoff and focused erosion to carve the gully network. The age of the forest tells us something about the age of the gully network, and our tree coring efforts indicate that most of the trees are less than 70 years in age. An aerial photograph from the 1930s shows a gully free pasture in that area.
Highland is an active farm and in recent years they’ve taken numerous steps to mitigate the impact of cattle in the riparian areas. Effectively all of the wooded area in the figure above is currently fenced such that cattle are excluded from the woodland and gully network – that’s good. Highland’s been proactive in the development of riparian buffers and has earned high marks for their ongoing land stewardship efforts.
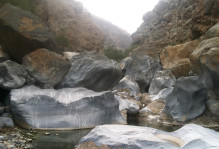
Massey Creek is a small creek that flows off the crest of Carter Mountain, as its gradient becomes progressively less steep it develops a low-slope alluvial floodplain. But then something curious happens, the creek drops over a small (~1.5 m), but suitably dramatic waterfall. For geologists, the waterfall is a knickpoint – a source of both joy and questions.
Below the knickpoint, Massey Creek has deeply eroded into its alluvium and forms an incised channel as is colorfully evident on the LiDAR-derived topographic map below. What’s the origin of this waterfall? Over time will this knickpoint remain stationary or will it migrate upstream?
So many questions.
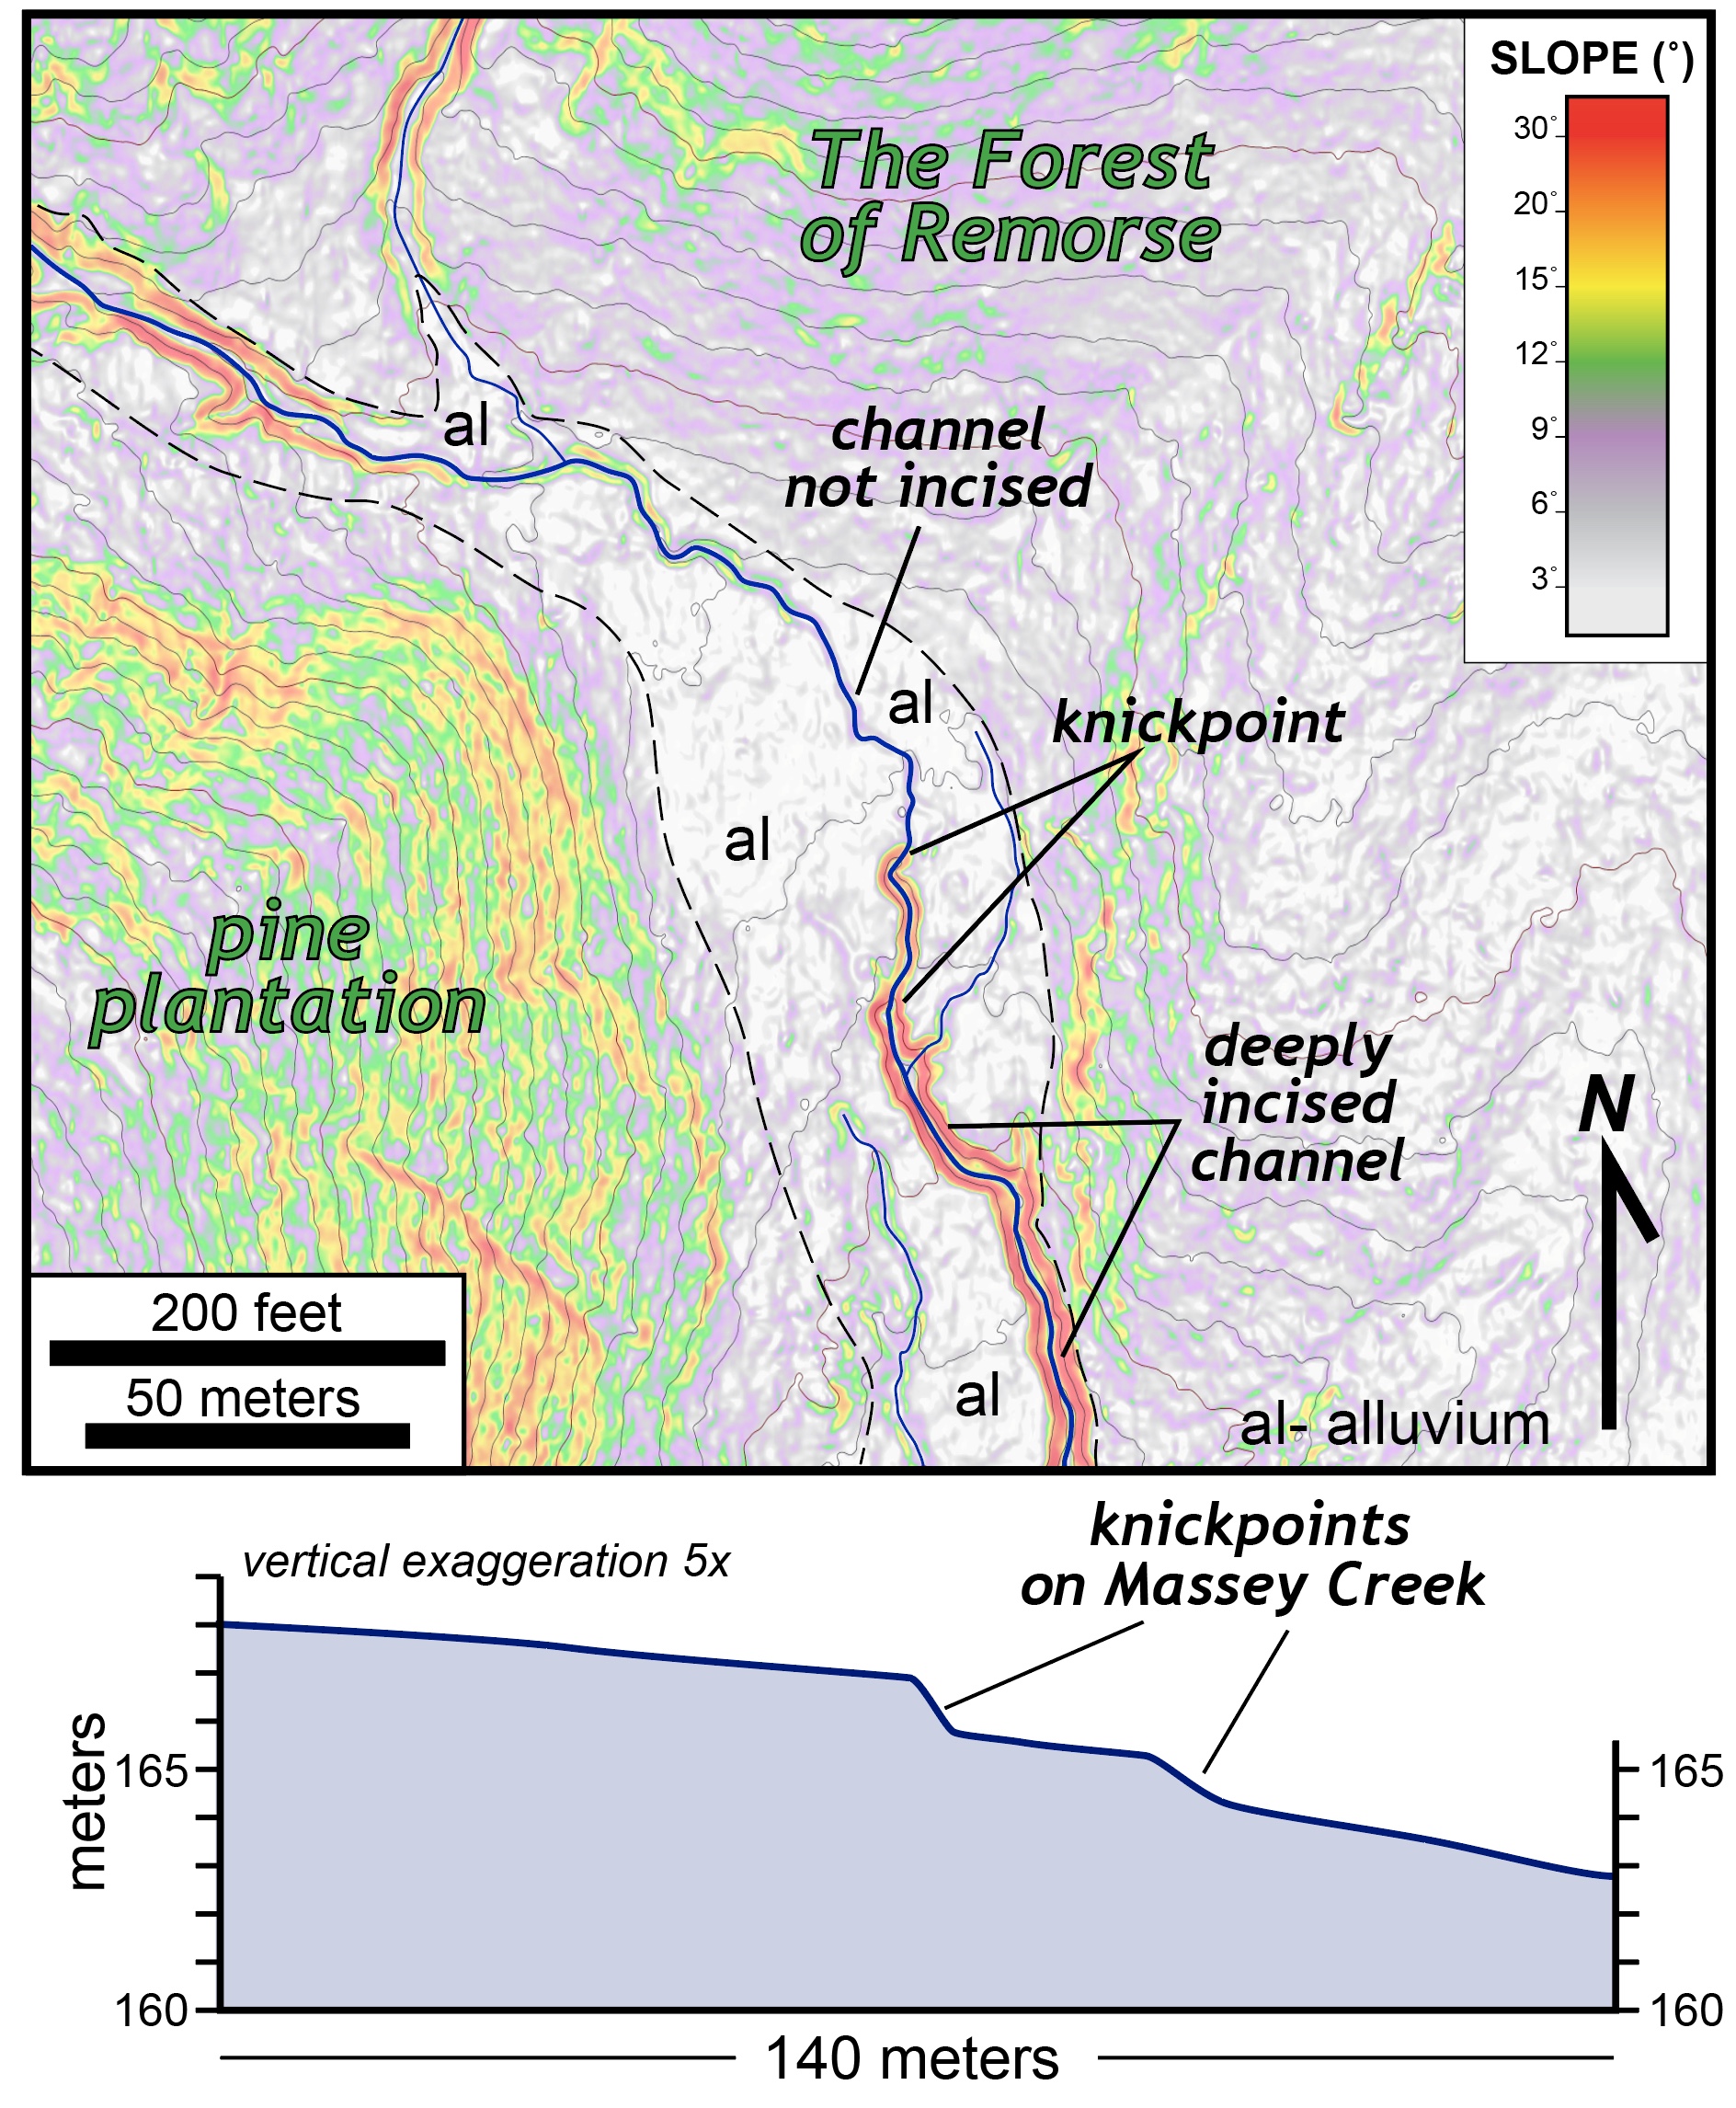
Massey Creek LiDAR derived topographic map with colored slopes illustrating alluvium and knickpoints.
The LiDAR topographic data enables us to ‘see’ many small features on the Highland landscape. Collectively, these landforms provide evidence to understand both the active processes as well as the landscape history at Highland.
I’ll finish with a few pictures of 2022 Field Methods class (aka ‘the Fun Bunch’) during their numerous people hours at Highland.
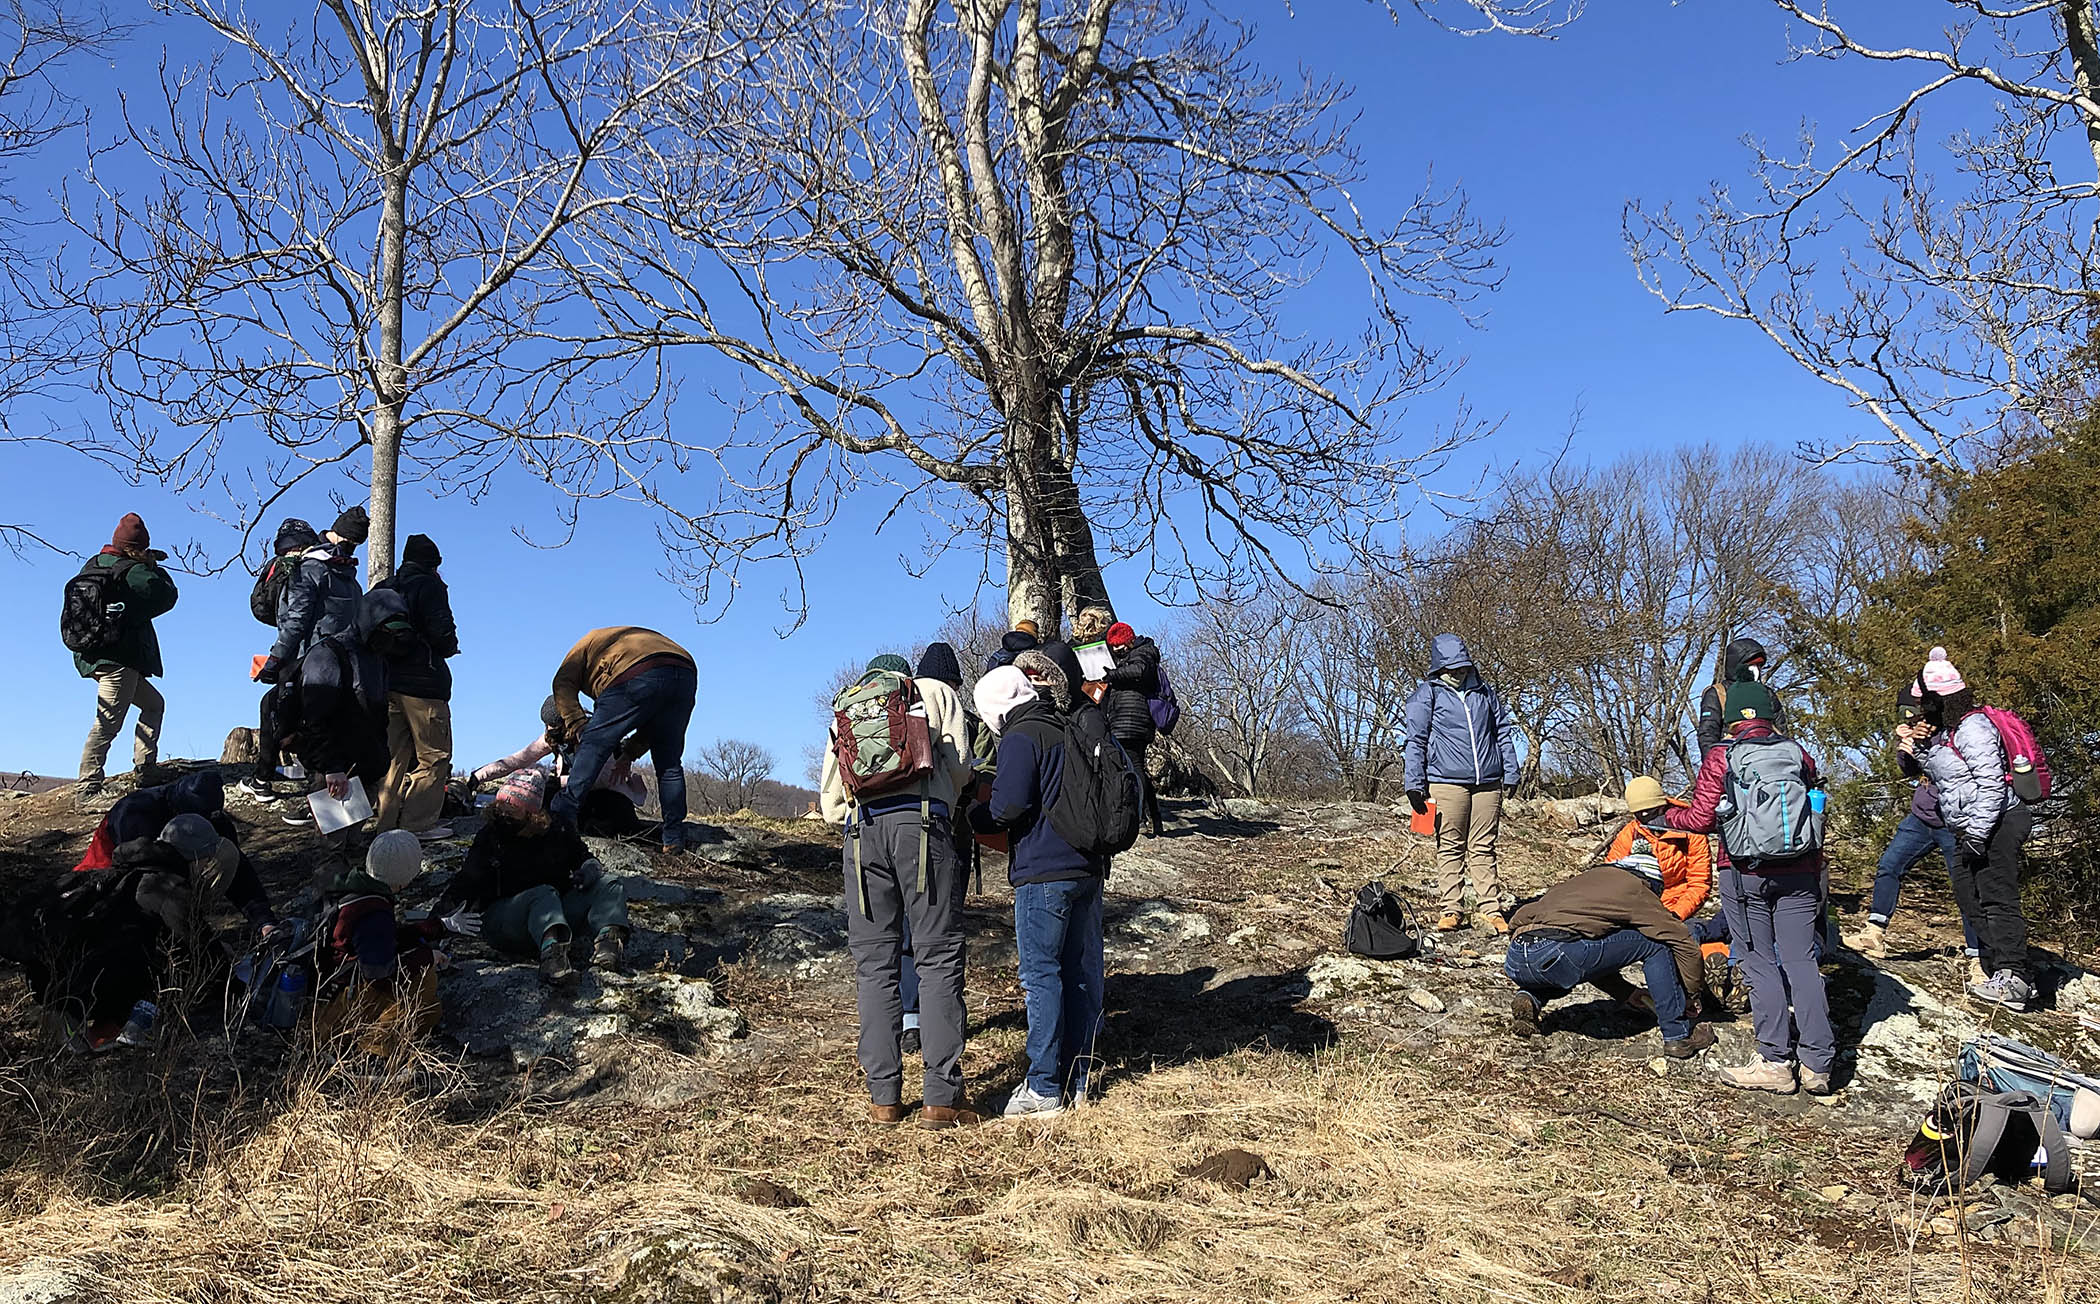
Bundled up and busy on a cold day at Busted Bivalve Rock.
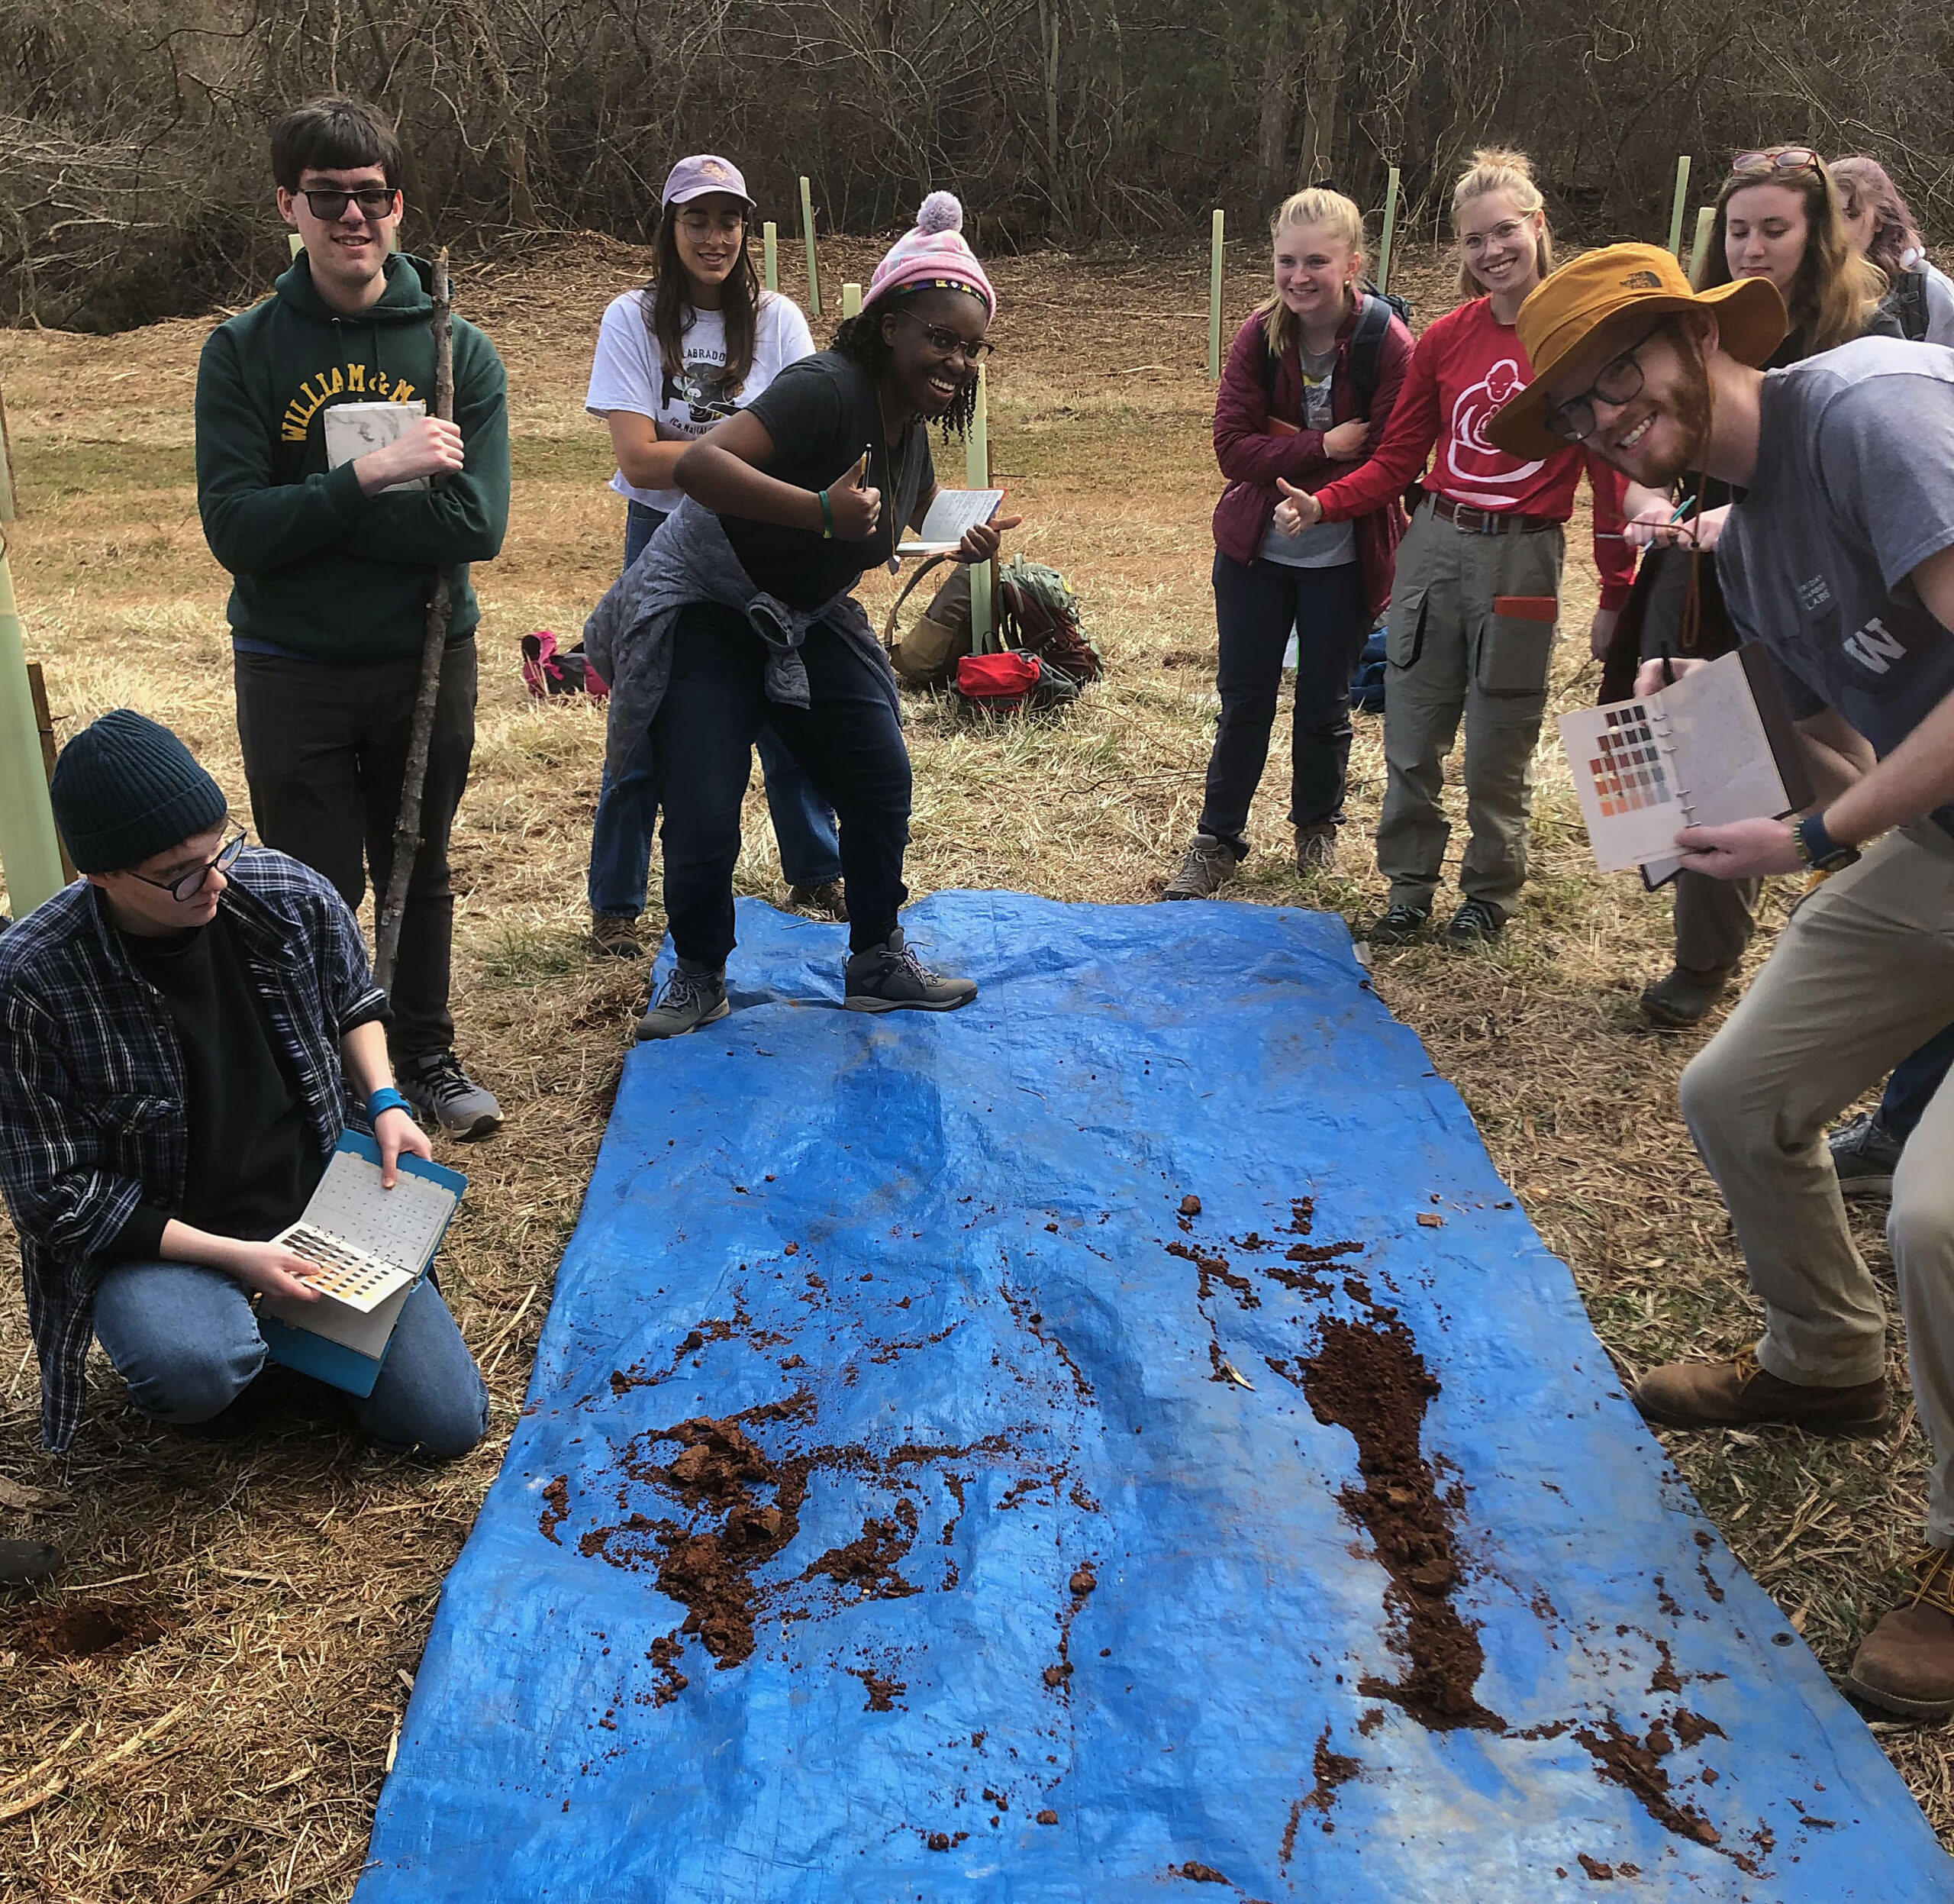
Field Methods posers after describing soil cores, the contents of which were laid out on the blue tarp.

Lunchtime at Highland.
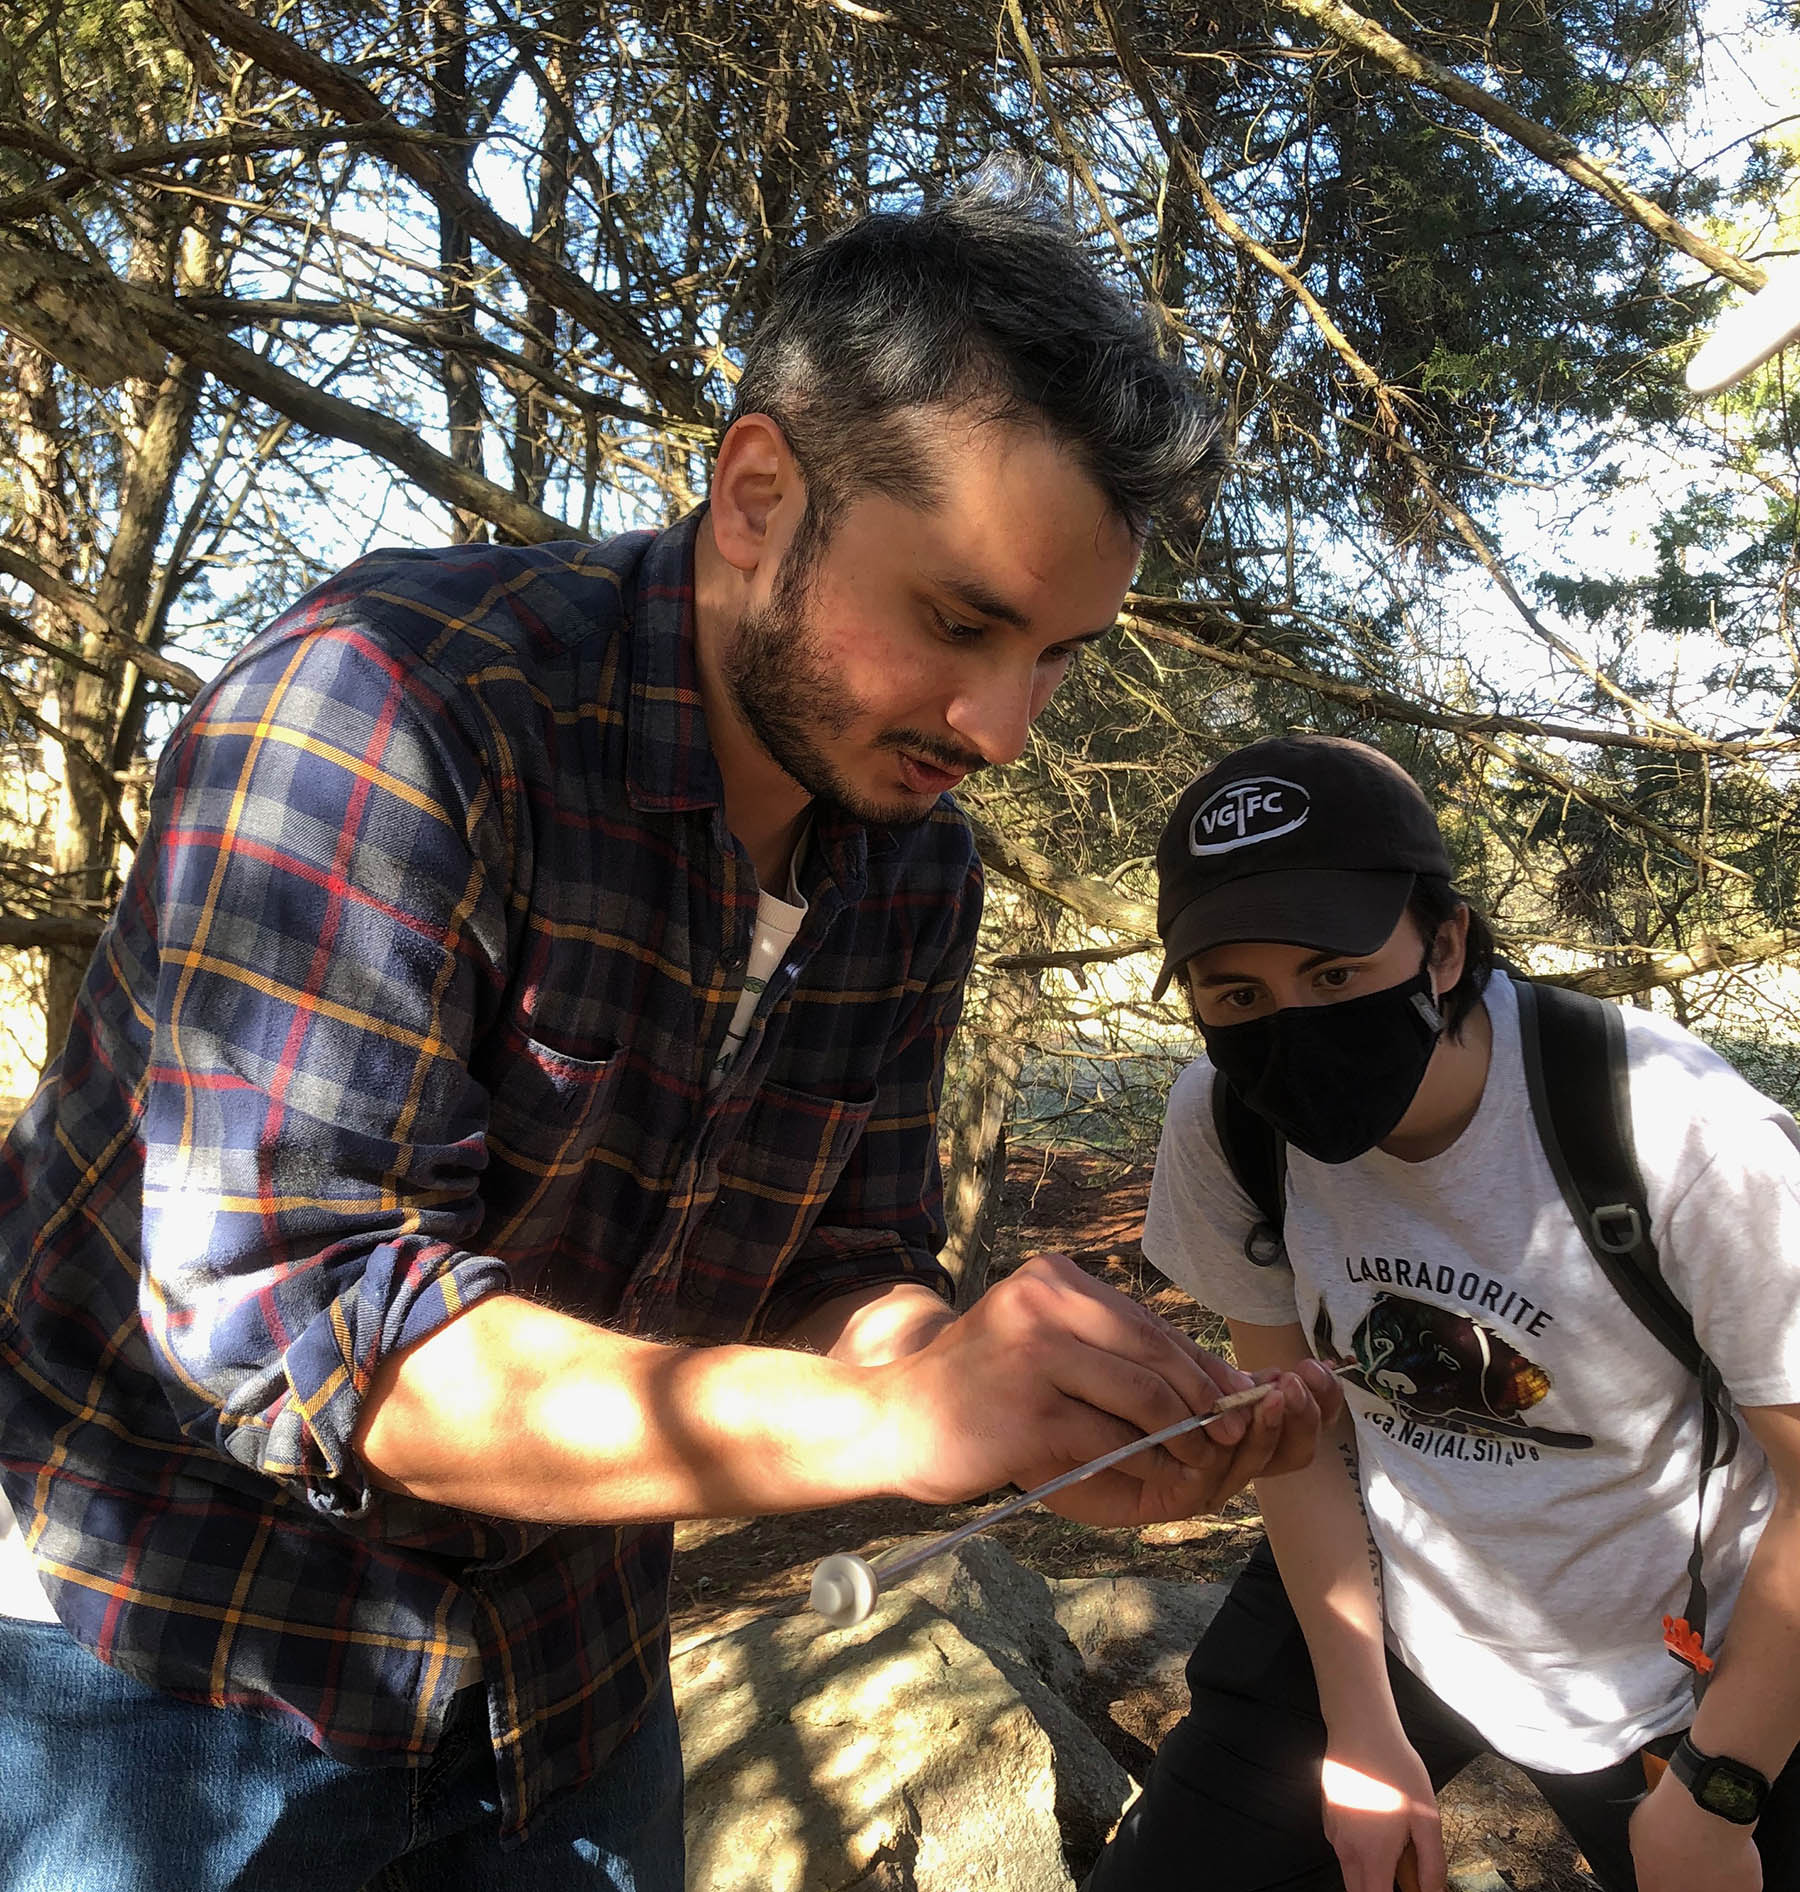
Professor Dom Ciruzzi shows off a tree core obtained in the East Gully woods.
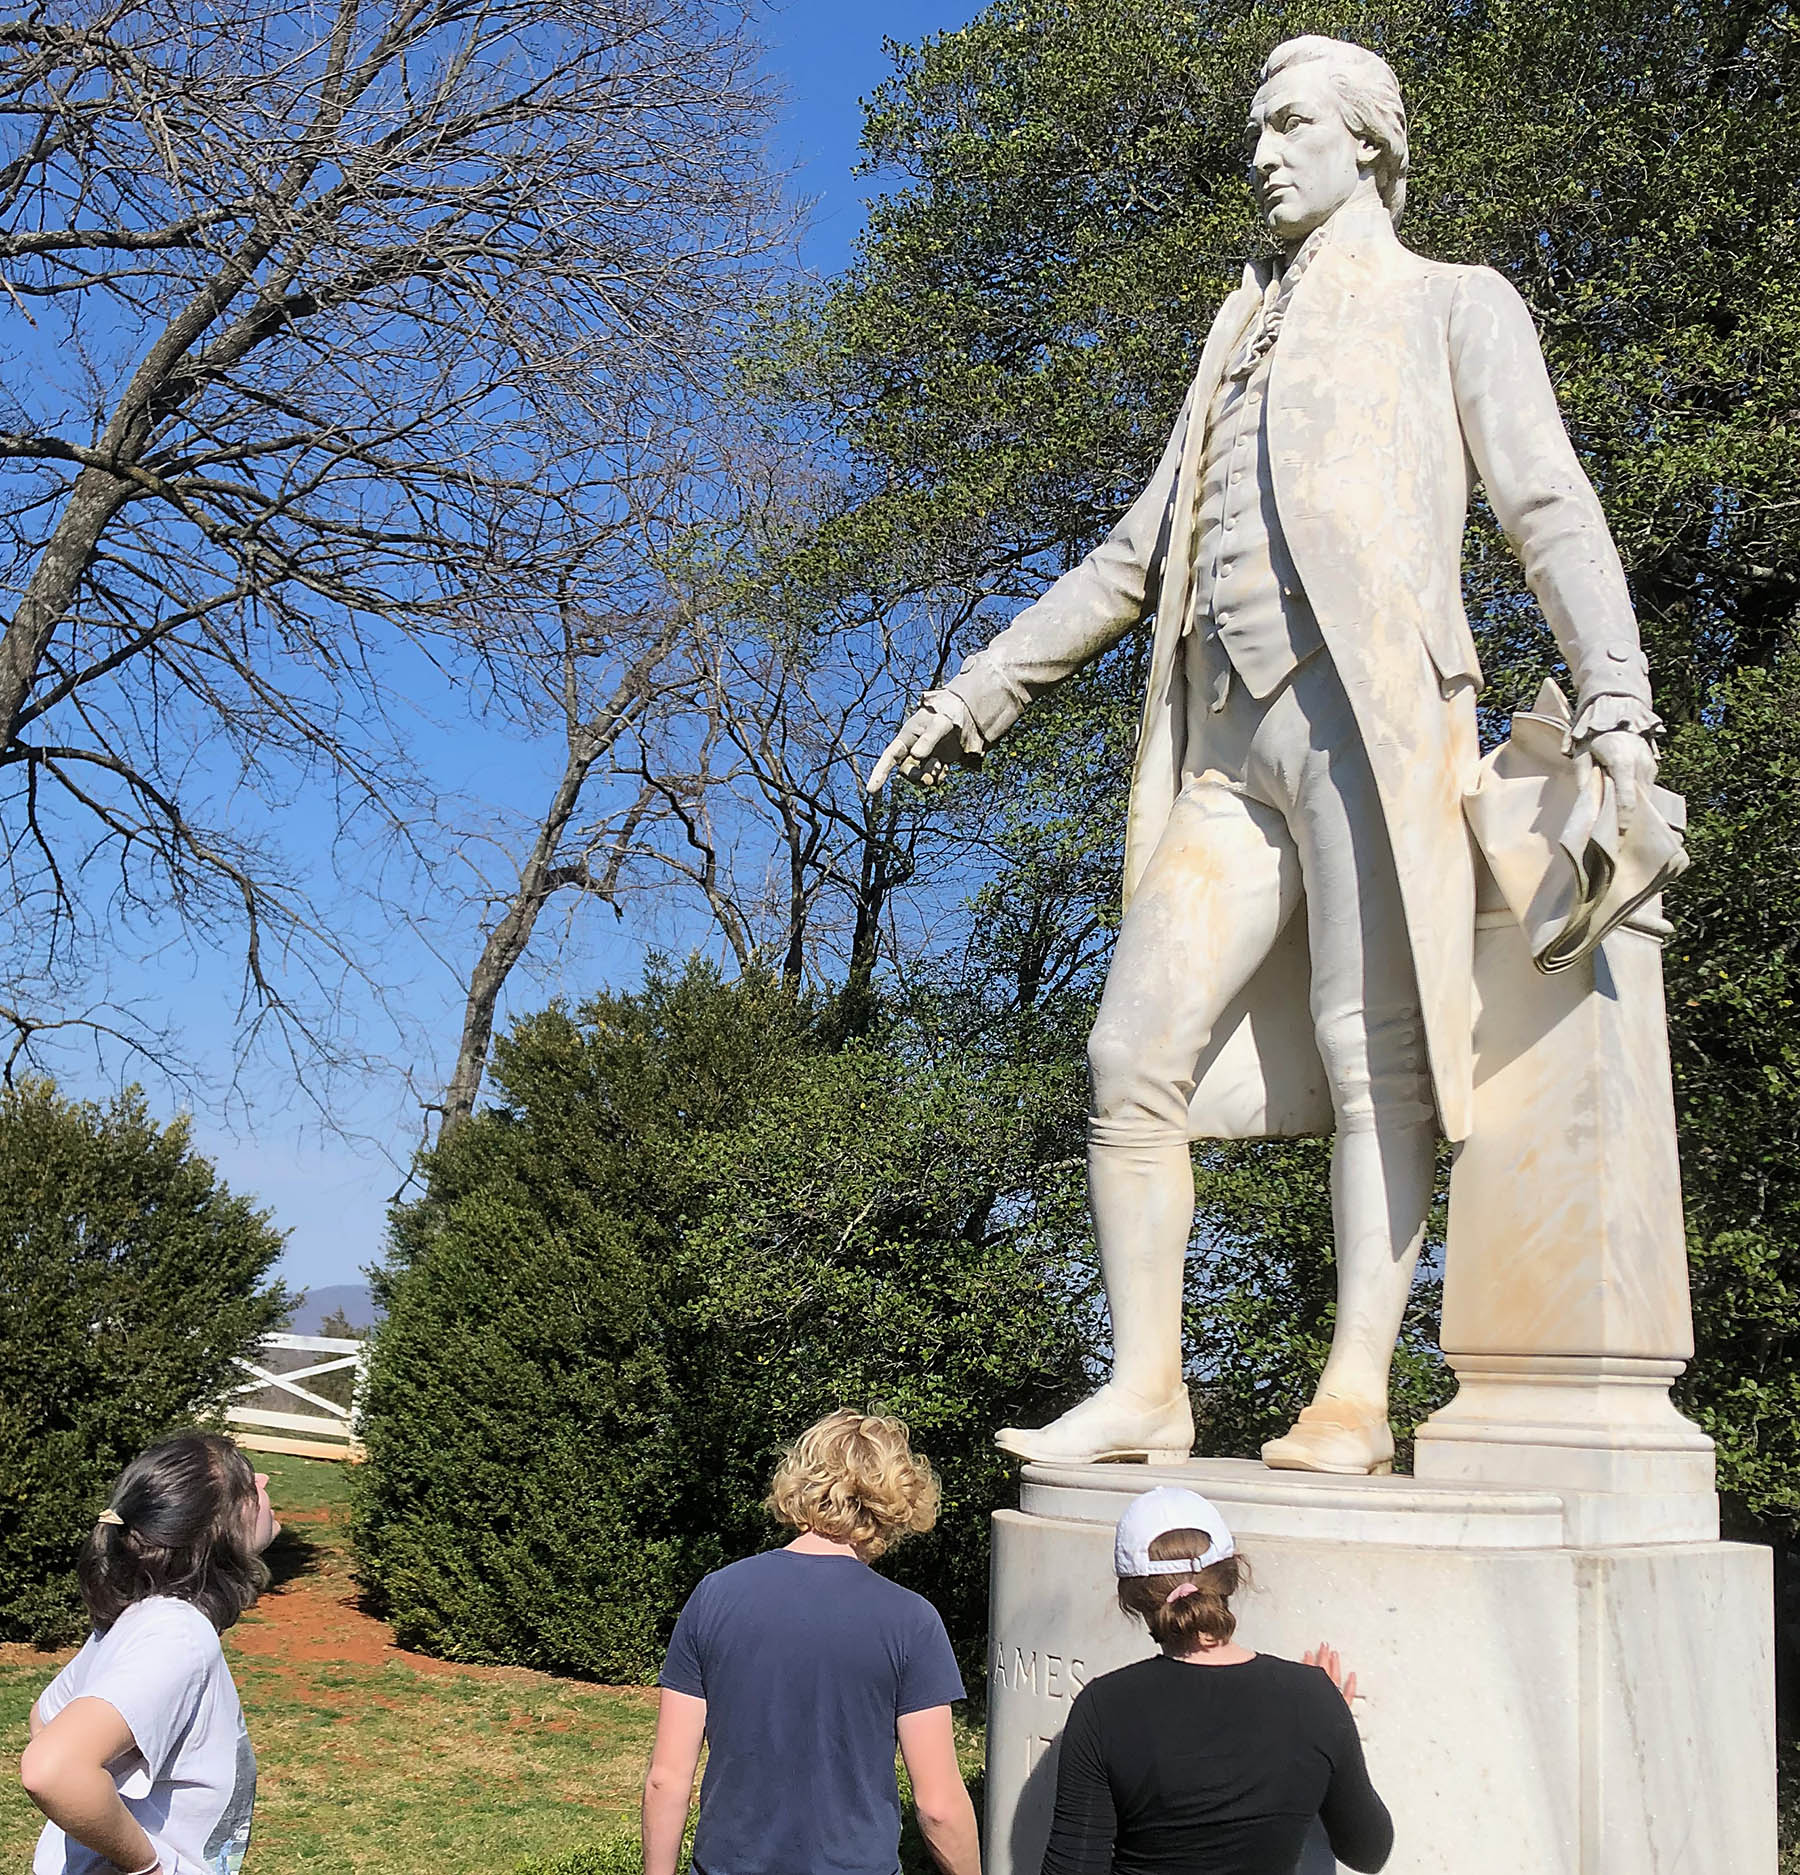
Contemplating the mysterious marble statue of Monroe.

Comments are currently closed. Comments are closed on all posts older than one year, and for those in our archive.
This blog has left me with so many questions (possible future senior theses???) How could you date the landslide feature? What is causing the knickpoint, and are there other streams with knickpoints near by? Awesome blog, with great work done by the class.
The skills taught in this class are very beneficial. I sleep better knowing that if I fail in my geologic career, I can fall back on being a land surveyor for the future I-64 construction.
The adventures we had at James Monroe’s Highland will be some of my favorite. From taking magnetometer readings and outcrop hunting to understanding how Dr. Sara Bon-Harper and her team are tackling the reinterpretation of Highland’s history, ensuring everyone’s story is told.
The field trips to Highland, getting all this information, and discovering new things was absolute fun! We know a lot about the recent (geologically recent) history of the land and now we’re going further back in time! I hope we can figure out how Highland is an important piece to the huge puzzle that is Virginia’s geology!
I love the work that is being done! And I learned a lot from this blog post! Great job!
This is so cool and such great information! The LiDAR movie is so cool and a great way to show the difference in textures. It’s fascinating how much information y’all were able to obtain! Great work to everyone!
Thank you for such good work.
I’m truly glad that I got to have these adventures before graduating! I’d been able to have a few cool trips last semester too and loved those, but the continuity with these ones was something different entirely. As a member of East Gully gang (A proud veteran of Team Isopod and Team Osage Orange), it was really interesting to find so many treasures down there, from that deer antler to all the history, both geological and anthropogenic. In all my previous trips, we’ve been very focused on geology in a vacuum– mineralogy and sedimentary history, mostly. This was the first time I had a trip that really stressed the relationship between natural geology and human land use, which was a super cool change of pace.
The stick that accompanied me on all the trips is still in my dorm. I intend to use it as my go-to walking stick in the future as well as a staff with which I will knight my friends because the Queen of England won’t stop me.
It was nice being able to take skills I was familiar with in my major (anthropology) and use them here, particularly because the work done at highland incorporated the human landscape into the geologic processes and impacts we found, rather than separating them out. Fun trip, cool blog, 10/10
Great post, Chuck! This class has really helped me visualize geology in the 3rd dimension, and I think that LIDAR is a great tool to accomplish that. The story of the geology and landscapes at Highland were just as interesting as the historical ones (special thanks to Dr. Sara Bon-Harper).
Never have I felt more 3-dimensional than I do now. The Highland project was a great learning experience, which introduced me to a number of exciting field tools that I will surely encounter again in graduate school. Additionally, tracking down bedrock outcrops and whacking them with a hammer really brought out the geologist in me. Thanks, Chuck!
Great information and video.
I loved getting to do fieldwork that wasn’t on the Coastal Plain at W&M. This was a great project to work on, and I’m excited to show everyone how much we learned about Highland!
Taking Field Methods and putting the skills I learned at Highland has been a joy! I’m so glad we were able to do fieldwork this semester. This is such a great blog post. Can’t wait to share more of what we have learned about Highland’s landscape!
Many excellent questions are posed in this post and I can’t help but think of more. In my own research I have found that James Monroe was notoriously bad about keeping records, quite contrastingly to his neighbor Thomas Jefferson. From the data we have collected, would it be possible to create snapshots of the past of Highland’s landscape? I believe it could prove fruitful to reconstructing life in the 18th and 19th centuries. From the proposed snapshots, we could perform analyses with geographic information systems. I think it would be fascinating to have a class or research project in the future involving a combined effort between the anthropology and geology departments!
Great article… but SNOUT? Is this a GSA approved term?
Slay
Great post Chuck, I really enjoyed lugging the magnetometer around the South pasture! It was great to learn new skills like surveying with a transit, coring and logging soil, and tree coring.
Very interesting to see tools in practice and the interpretation of the data. I know a historic farm near the Catskills that would make for fascinating study. Well done “fun bunch!”
So really enjoyed this along with the blogs done before. The writing brings so much to light. Thank all of you for the hard work put in to this.
Wonderful post, Chuck! I enjoyed our trips to Highland this semester and can’t wait to continue in the future! This post leaves me with even more questions than before! I’m thankful for learning new skills such as tree coring and topographic surveying with the transit. Getting shocked by the cattle fence was totally worth it!
It was the best of times, it was the worst of times. While I enjoyed learning about history and geology simultaneously during our time at Jimmy Monroe’s crib, I had to endure the shame of not knowing how to use a brunton during our first (and allegedly second) field trips. Oh the nights I spent awake! OH THE HORROR! Never has there been a Structure and Tectonics senior more downtrodden and woeful than myself in my vain attempts to act like I knew what I was doing. In the time since however, I have grown. I have mastered Wizard Bailey’s weapon of choice, and learned how to calculate Solar Elevation Angles and stuff. And for that I have my pal Chuck to thank. That doesn’t mean I voted for him for GSA president, but I guess that’s the beauty of Democracy as I’m sure James Monroe would agree.
As cool as it was to actually be doing research on-site, I think one of the most impressive parts of the project is the topographic map made from the LiDAR data. In particular, I’m surprised that the mapping system is so good at stripping away vegetation. I’m hoping to eventually learn more about LiDAR in later geology courses!
It was really wonderful working collaboratively with other geo majors in so many different project areas! Truly a communal effort to explore the property and learn a diverse set of useful field skills.
I am so grateful for this experience in geology to inform my understanding of environmental sciences. I came in with zero knowledge, and feel I got so much out of the experiences in Highland and data collection methods we used. Thank you so much for a great semester!!
This was such a fun experience and it taught me lots on how to use geologic equipment that I had never touched before! It is really interesting too see what Highlands had to offer and I’ve learned lots of geology.
My top three moments at Highland were as follows:
1. Teaching everyone how to auger soil cores (Soil Sisters FOREVER!!!)
2. Finding the awesome outcrop in Massey’s Creek and then finding our best friend the Blue Heron (RIP)
3. Lunches with the Highland Heroes (& meeting Chuck’s lovely mom!!!)
Learning in the field at Highland was simultaneously so fun and educational – hear more about it in my final reflection!
This was easily my favorite class this semester because of just how involved everyone could get and how varied the geo content was. Chuck is a top tier professor, scientist, and field guide!