
All Shook Up! The 2011 Virginia Earthquake
As the year comes to a close it is a fine time to reflect on the 2011 Virginia earthquake. It’s been four months since the Virginia earthquake jolted eastern North America, and we now know more about what happened. This moderate-size (Mw=5.8) quake–felt by millions of people from Alabama to Quebec–caused significant damage in Louisa County, cracked both buildings and nerves in Washington D.C., and served notice that there is still some kick left in these ancient rocks.


Seisomograms generated from the Virginia earthquake. Modified from- http://rev.seis.sc.edu/earthquakes/2011/08/23/17/51/03
What Happened on August 23rd?
At 1:51:04 p.m. (EDT) a fault ruptured at a point some 4 to 5 km (2.5 to 3 miles) below the Earth’s surface in Louisa County, Virginia (~60 km northwest of Richmond). As one side of the fault slid past the other, seismic waves radiated outward from the source area. The primary waves (P-waves) raced away at nearly 6 km/second: sweeping through Richmond 11 seconds after the quake, passing through Williamsburg in 20 seconds, and arriving at the West Coast in about 5 minutes. The primary waves were followed by shear waves and salvos of surface waves, these were the jolts that people felt. On the William & Mary campus; shaking perceptible to humans lasted about 20 seconds. At the North Anna Nuclear Power Station, 21 km from the epicenter, peak ground accelerations reached ~250 cm/sec2, more than sufficient to damage unreinforced masonry structures in the epicentral region.
The Virginia temblor was a moderate earthquake. Worldwide there have been 344 earthquakes of magnitude 5.8 or greater this year, which averages out to about one quake of this size (or larger) per day somewhere in the world. What makes this quake special is that it was the largest quake to rock the eastern United States in over a century and was felt by more people than any other quake in U.S. history. At the recent American Geophysical Union meeting, Shao and others report a seismic moment of 5.75 x 10¹⁷ Newton meters for the quake, which translates into ~35 terajoules of energy released (for comparison, World War II-era atomic bombs packed an energy punch of 50 to 90 terajoules).
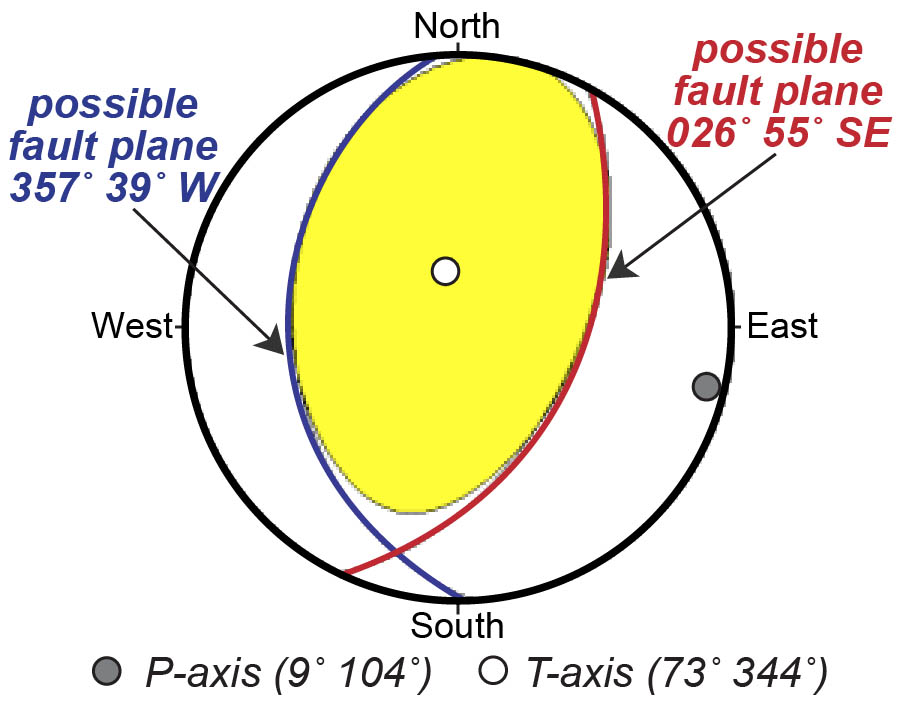
Beachball diagram from USGS/SLU Regional Moment Solution. Modified from- http://earthquake.usgs.gov/earthquakes/ eqarchives/fm/se082311a_rmt.php
The nature of seismic wave first arrivals at seismic stations helped define both the geometry and type of fault that slipped. The diagram to the right is a first motion diagram, in essence a stereographic projection that forms a visual representation of the fault style and defines two possible fault orientations for the Virginia earthquake. For the uninitiated these diagrams are confusing, geologists commonly refer to these diagrams as beachball diagrams.
Based on the pattern of first arrivals, the fault that slipped was a reverse fault striking to the north or northeast and dipping moderately either to the west or southeast. With these data alone the fault cannot be uniquely determined- it could be either plane. The P- and T- axes represent the axes of maximum contraction and extension respectively; in essence the Earth’s crust in central Virginia was shortened in an approximately east/west direction from the quake movement.
Within a day or so after the earthquake, seismologists from Virginia Tech and the U.S. Geological Survey had an array of portable seismometers installed in central Virginia. This equipment recorded hundreds of aftershocks. Most of these aftershocks were small (M= 1-3), but Louisa County residents certainly felt them.
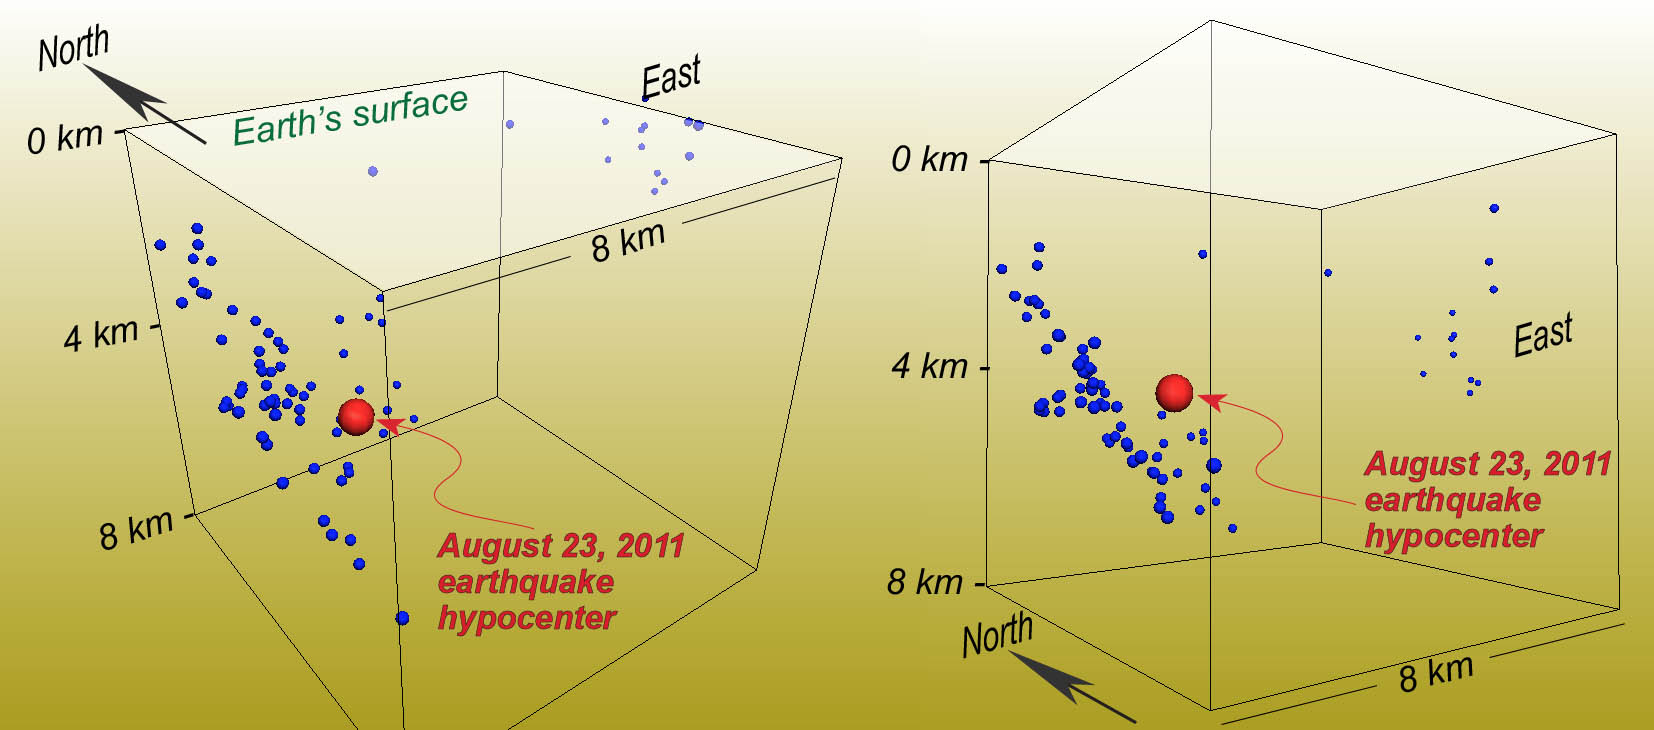
Block diagrams illustrating Virginia earthquake hypocenter (red) and aftershocks (blue). Left- Oblique downward view to the northeast. Right- Oblique view to northeast from below the Earth’s surface. Note- planar alignment of many aftershocks. Aftershock locations from- http://www.geol.vt.edu/outreach/vtso/2011/0823-louisa/
The aftershock pattern clearly reveals the fault geometry: the earthquake occurred on a northeast—striking fault that dips about 50 to 55˚ to the southeast. Click on the link below to watch a short animation. The aftershocks are blue spheres, notice how they mostly line up neatly along a plane—that is the fault that slipped. The big red sphere (the August 23rd quake) plots off the plane, that quake was located by a regional network of seismometers and is not as accurately located as the aftershocks pinpointed by the locally deployed array of seismometers.

Block diagram of the central Virginia Piedmont illustrating 2011 earthquake hypocenter on a southeast dipping reverse fault. Note- rupture did not reach the surface. Oblique view to the northeast.
During the quake the southeastern side of the fault (hanging wall) was shoved upward with a maximum displacement of about 1 meter. The total rupture length along the fault was likely 5 to 10 kilometers. There was no rupture at the surface because displacement across the fault did not propagate all the way to the Earth’s surface. The 2011 earthquake occurred along a blind, and previously unrecognized, reverse fault in the Virginia Piedmont.
Geology of the Piedmont
The earthquake occurred in the Piedmont, a region of complex geology that is the metamorphic core of the Appalachian Mountain system. Some of these rocks originated far from North America and were later crushed against the continental margin during tectonic collision and faulted to their current location. In the past twenty years geologists have distinguished many different terranes in the Piedmont: terranes are blocks of crust with distinct geologic histories and are bound by major faults or tectonic sutures. The difference between terranes is well illustrated on the aeromagnetic map displayed in the animated map sequence below.
The 2011 Virginia earthquake occurred in the Chopawamsic terrane. Rocks in this terrane formed as volcanic and plutonic rocks in a continental arc during the Ordovician Period (~470 to 450 million years ago). This arc was likely outboard of ancient North America and was later accreted to the continent. In the late Paleozoic (300 to 280 million years ago), during the massive tectonic collision that created Pangaea, these rocks were squeezed and baked (deformed and metamorphosed) into gneisses and schists. The Chopawamsic terrane is bound on the northwest by the Brookneal/Shores fault zone and on the southeast by the Spotsylvania fault zone. Our kinematic studies of these fault zones indicate that they experienced simultaneous right-lateral wrenching and shortening when they were active in the Paleozoic. In essence, the Spotsylvania fault zone moved the Goochland terrane to the southwest and the Brookneal/Shores fault zone moved the Chopawamsic terrane to the southwest relative to the western Piedmont.
Animated map of the central Virginia Seismic Zone illustrating geography, geologic terranes, basins, faults, aeromagnetic patterns, and earthquake epicenters (1774-2011). Frames flash in every 4 seconds. Earthquake data from the Virginia Tech Seismological Observatory. Geologic data from numerous sources. NA- North Anna Nuclear Power Station.
In the Triassic Period (220 to 195 million years ago) Piedmont terranes were fractured and broken during rifting which created sedimentary basins, such as the Culpeper and Richmond basins. This rifting ultimately opened the Atlantic Ocean. Traditionally, geologists have viewed the Piedmont as a relatively static region whose tectonic heyday was long past. Today, it is a gently rolling landscape mantled by thick soils, the product of slow erosion for millions of years and a seeming dearth of tectonic activity.
But as my colleague David Spears at the Virginia Division of Geology and Mineral Resources has pointed out, there are subtle clues in the rock structure of the central Piedmont that suggest recent tectonic activity. The 2011 quake was a not so subtle reminder that David is correct and we need to get our boots on the ground and eyes on the outcrop to study the region in more detail.
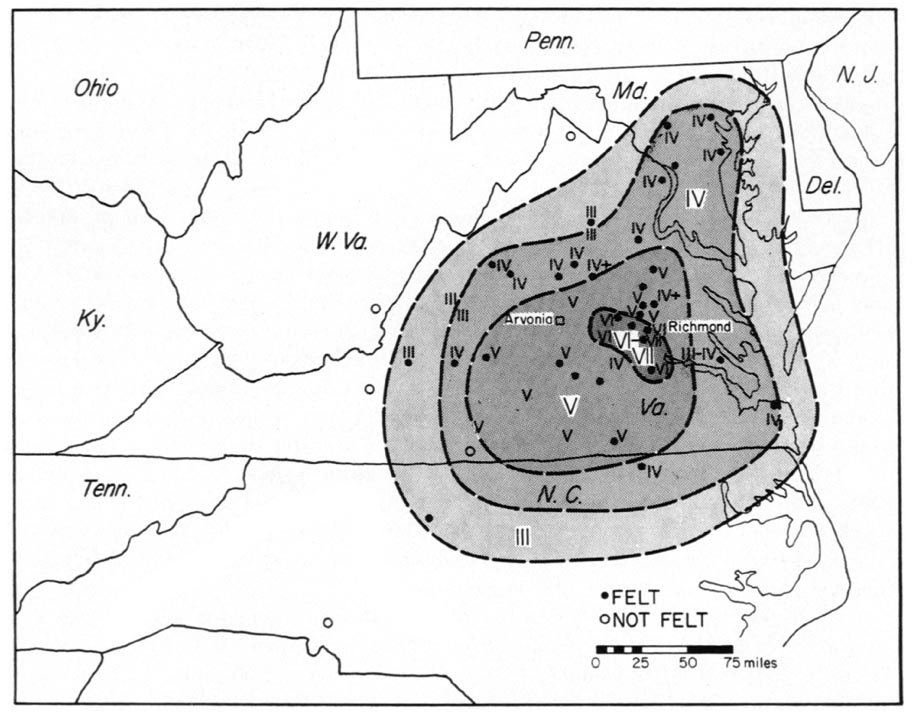
Isoseismal map for the December 23, 1875 earthquake. Map from Bollinger and Hopper, 1971, Seismological Society of America Bulletin, v. 61, p. 1033-1039.
The Central Virginia Seismic Zone
The Central Virginia seismic zone is a region of moderate but persistent seismic activity. The first recorded quake occurred in 1774 near Petersburg and was felt throughout Virginia and North Carolina. The largest historical quake (prior to the 2011 temblor) in the central Virginia region took place in 1875 and is estimated to have been a magnitude 5.0. Estimating both the size and exact location of historic earthquakes is difficult. Geologists use the Modified Mercalli Intensity Scale to estimate the size of historical earthquakes based on eyewitness accounts and damage reports. This is a 12-point scale that employs roman numerals, with a II being a quake so small that only few people felt it, a IV being felt by many people indoors, a VI being felt by all with some damage to plaster and masonry, a VIII causes considerable damage to structures, a X destroys most structures and the ground is thoroughly cracked, and a XII equals total damage. The intensity of damage decreases away from the epicenter. The 1875 quake reached an intensity of VI to VII in central Virginia; the 2011 quake had a maximum intensity of VIII in Louisa County whereas in Williamsburg the quake’s intensity was a IV.
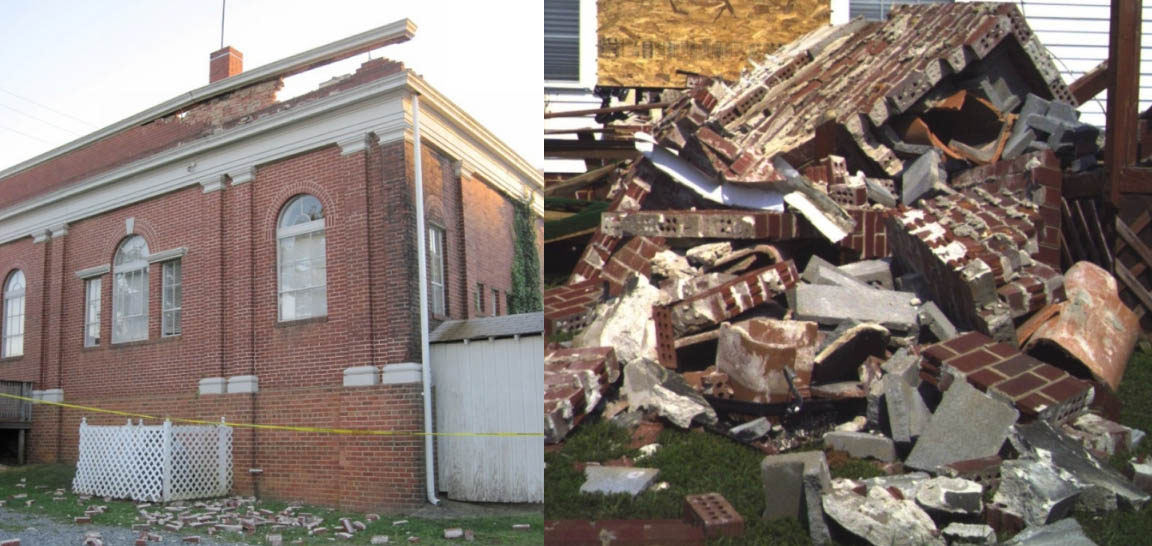
Damage from the 2011 earthquake in Louisa County, Virginia. Source- http://www.dmme.virginia.gov/DMR3/5.8_earthquake_album.shtml
By the late 1970s a regional array of permanent seismic monitoring stations helped better locate and measure earthquakes in the southeastern United States. Over the past three decades there have been 47 quakes with a M≥2 in central Virginia (22 of those are aftershocks from the 2011 quake). These quakes are widely distributed and rarely correlate to mapped faults (see the animated map above). The focal mechanisms are consistent with slip on reverse faults at depths between 4 to 10 kilometers. At these depths, the rock is warm (70˚ to 200˚ C or 160˚ to 400˚ F), but solid and behaves in a brittle fashion when placed under stress.
There is more to tell, but my research students counseled me to curb my enthusiasm, as blog posts should not be too long. In the next post I’ll discuss the possible causes of the 2011 earthquake and tell the lurid history of finding fault at the North Anna Nuclear Power station.

Comments are currently closed. Comments are closed on all posts older than one year, and for those in our archive.
Thanks Chuck! Very helpful and I eagerly await chapter 2! I remember the piedmont guys talking of faults at the North Anna site, but was too young and too focused on V&R stuff to pay much attention. Unfortunately… I guess the EQ requires an addendum to the book in press?
It’s tough out there and it’s literally impossible for a single person to track down every opening with every employer, especially in a big city like Seattle. I know my sister recently came across a site called http://www.employmentCrossing.com and she said they have requirements from everywhere. I guess they collect jobs from all the public job boards so that you don’t have to jump from site to site to find every job in your field or city, and the best part is that they even collect jobs off employer websites too. You literally can find pretty much every job out there in one place. I honestly think you should check it out.