The Third Time is the Charm?
My Geology 110 course, Earth’s Environmental Systems, is a big class. 195 students are enrolled and we meet for 50 minutes at 9 a.m. on Monday, Wednesday, and Friday. A big part of my job is to keep these 195 students engaged during our class meetings. This semester I am using LectureTools, a web-based software tool, that allows students to follow my presentations, ask questions, answer questions, and solve problems in class using their laptops, iPads, and smart phones. I get real time feedback from students: “Chuck, that last slide confused me”, “Chuck, please don’t put that question on the exam!”, etc. I ask questions and we can collectively see just how well they’ve done. Based on the answers I can change the pace or direction of the lecture. LectureTools has much promise. Thus far, the response from students ranges from mildly positive to robustly jubilant.

Geology 110 students using their laptop computers and LectureTools during class. I’m arm-waving at the front of the class. So who is on Facebook and who is checking their email? Photo by Pablo Yanez.
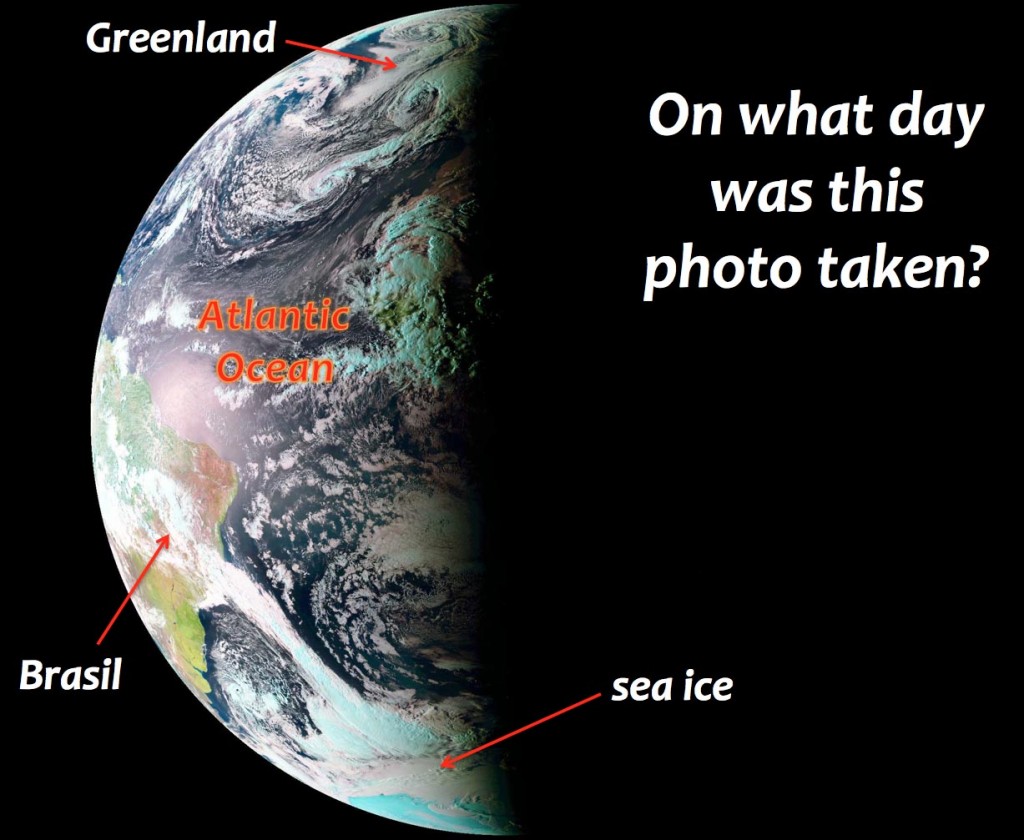
Understanding spatial relations on planet Earth is at the heart of understanding the Earth’s Environmental Systems. For many students, sorting out spatial relations is a challenge. We’ve considered solar elevation angles and insolation which leads to thinking about the Earth’s seasons and its axial tilt. Last Friday, I put up this satellite image of the Earth and asked:
On what day was this photo taken?

Annotated image of Meteosat 9 satellite taken on September 22nd, 2012 – the autumnal equinox in the northern hemisphere.
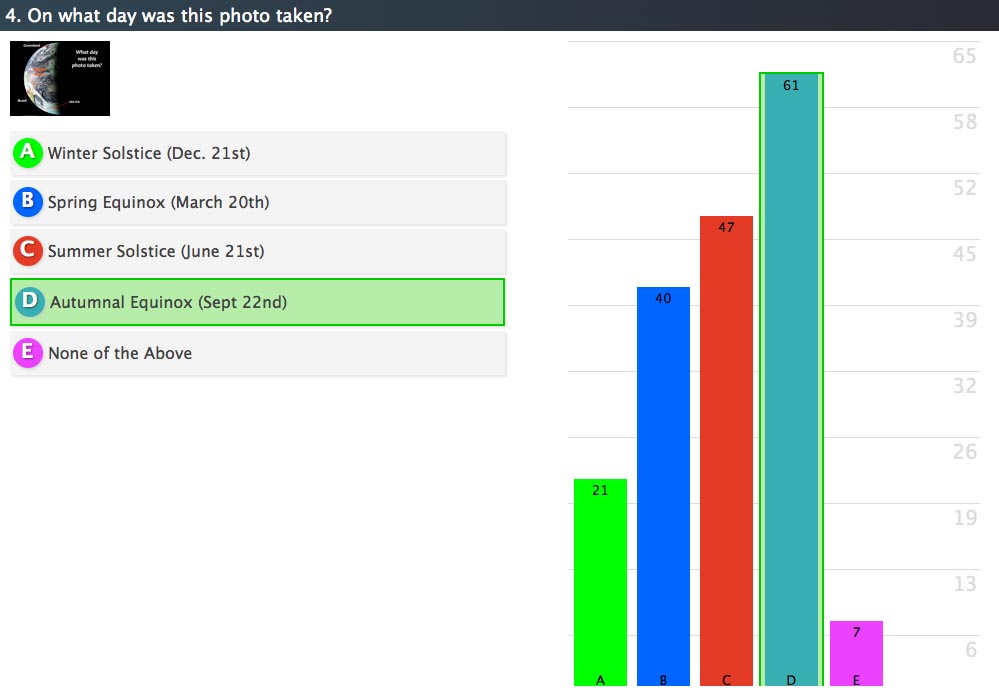
Notice the Earth is illuminated from its far northern reaches (Greenland) all the way to the Southern Ocean and Antarctica. The picture was taken by the Meteosat 9 satellite on September 22nd—the autumnal equinox (for the northern hemisphere). I expected it would be easy to tell that it was one of the equinoxes. But which equinox? The abundant sea ice in the Southern Ocean means that the region is emerging from its winter (the northern hemisphere’s summer). The results from my class were far different than my expectation. 61 of the students got the answer correct (that’s 37%), but 63% of the responses were incorrect and more people chose the summer solstice over the spring equinox. Yikes, we have a problem.
Having the results for everybody to see, immediately after students have answered a question is a great innovation. I then talked the class through the observations required to know that the image was taken on the autumnal equinox.
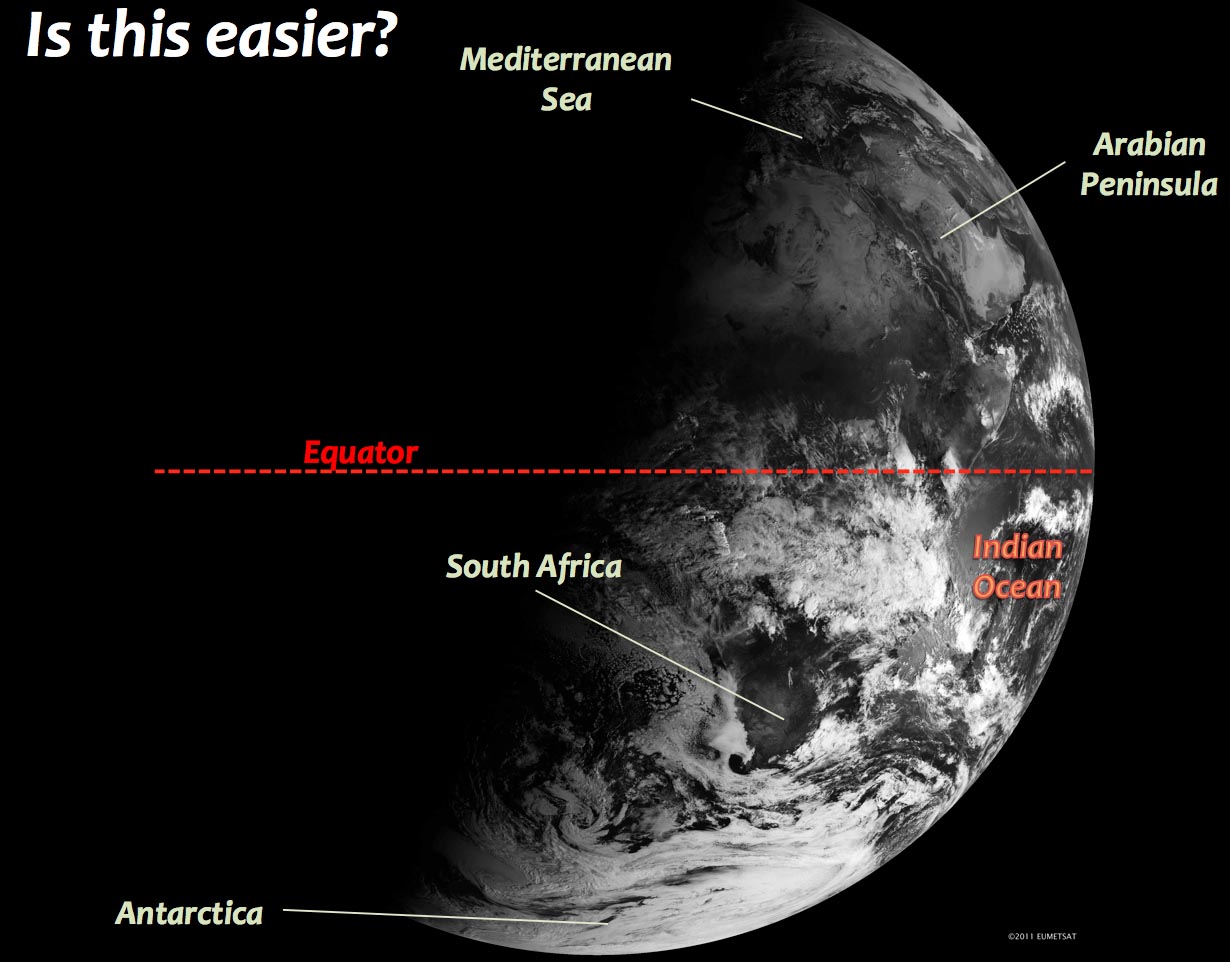
On Monday morning I tried a similar question on my charges.
Indeed this photo was obtained on the December solstice as evidenced by the illuminated region in the Antarctic and the darkness in the northern latitudes. A majority of the class got the question correct, but a sizable fraction was still confused. Better results, but not what I was hoping for. I followed this question with an annotated image illustrating a tilted Earth and a labeled equator. It’s all so easy when things are labeled!
On Wednesday I threw the class a related question and assumed that the third time would be the charm. LectureTools enables me to ask image questions in which students click on a map or an illustration to answer a question. My question concerned the current location of the subsolar point at 9:30 a.m. (EDT) on Wednesday, October 3rd. The subsolar point is the place on the planet where the Sun is directly overhead (solar elevation angle = 90˚).
The autumnal equinox had passed 10 days earlier, thus the subsolar point is a few degrees south of the equator. It was mid-morning in Williamsburg and in Greenwich, England (located on the Prime Meridian) it was mid-afternoon, thus noon (the time when the Sun reaches its zenith) was to the east of Williamsburg and to the west of Greenwich. The subsolar point at that moment was in the Atlantic Ocean to the east of Brazil.

Google Earth image I used as a Lecture Tools image question. The yellow dots are student answers. The dashed white box surrounds the region of quality answers.
A sizable fraction of the class placed the subsolar point in the Atlantic Ocean to the east of Brazil—nice work! Unfortunately, others placed the subsolar point in the northern hemisphere or worse yet, far to the north of the Tropic of Cancer (that never happens!). Not good news. But this in-class assessment paints a clear picture of what students grasp and, more importantly, don’t grasp. Back to the drawing board? I’ve got to figure out how best to help students learn these concepts and master spatial relations. I am a believer in “Practice Makes Perfect”, we shall see what the fourth try brings!
Comments are currently closed. Comments are closed on all posts older than one year, and for those in our archive.


Did you try showing the animated version of the Meteosat solstice/equinox data? I’m curious to know if it works better than static images.
http://earthobservatory.nasa.gov/IOTD/view.php?id=52248
So great to see technology being leveraged in the classroom to promote engagement! Keep up the great work and keep talking about it!
I’ll admit that I was one of the people who got the first one wrong, but after the explanation of it, I understood what to look for and how to do the others…still not sure why someone would put the sun’s location north of the Tropic of Cancer!