Down the James in Three Days
The James River’s basin spans much of Virginia. Its headwaters start amongst the high ridges of the Allegheny Mountains, and the river system covers some 700 kilometers (~400 miles) before debouching into the Chesapeake Bay at Hampton Roads. The river crosses four of Virginia’s five geologic provinces and exposes a wide array of rocks. Outcrops in and along the James provide key exposures for geologic research, and I’ve written about our numerous adventures on the river before. It is also an ideal watershed for reflecting upon hydrologic systems.

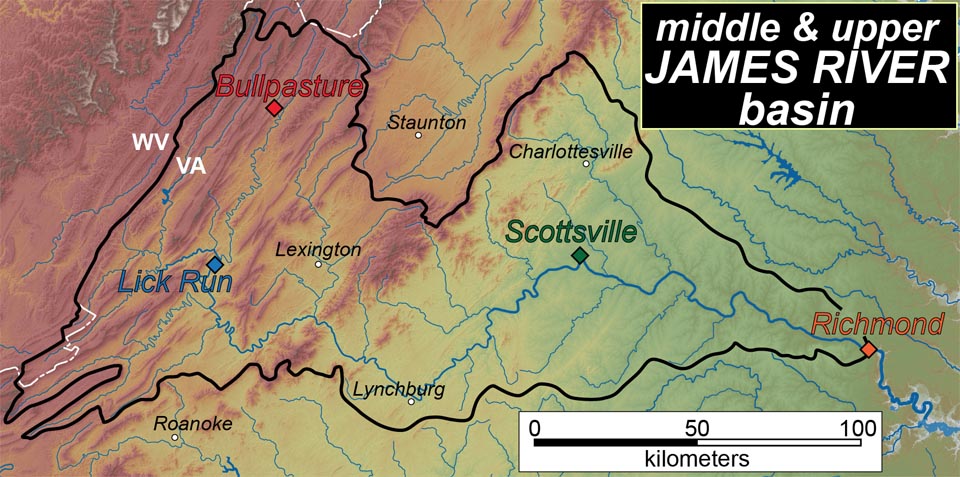
Overview map of the middle & upper James River basin with 4 U.S. Geological Survey gaging stations highlighted.
Last week a weathermaker crept northeast from Louisiana and brought rain to the mid-Atlantic on Tuesday the 18th. Some parts of the Appalachian Mountains received 3 to 5 inches of rain; eastern Virginia garnered less precipitation, but all in all it was a rainy day across the region. In the coming weeks I’ll ask my Earth’s Environmental Systems class to consider what happens throughout a drainage system when it rains, but this late September event was, dare I say, a textbook example of a flood wave passing through a basin and worthy of a post.

Observed precipitation in the mid-Atlantic region on September 18th, 2012 (from the National Weather Service).
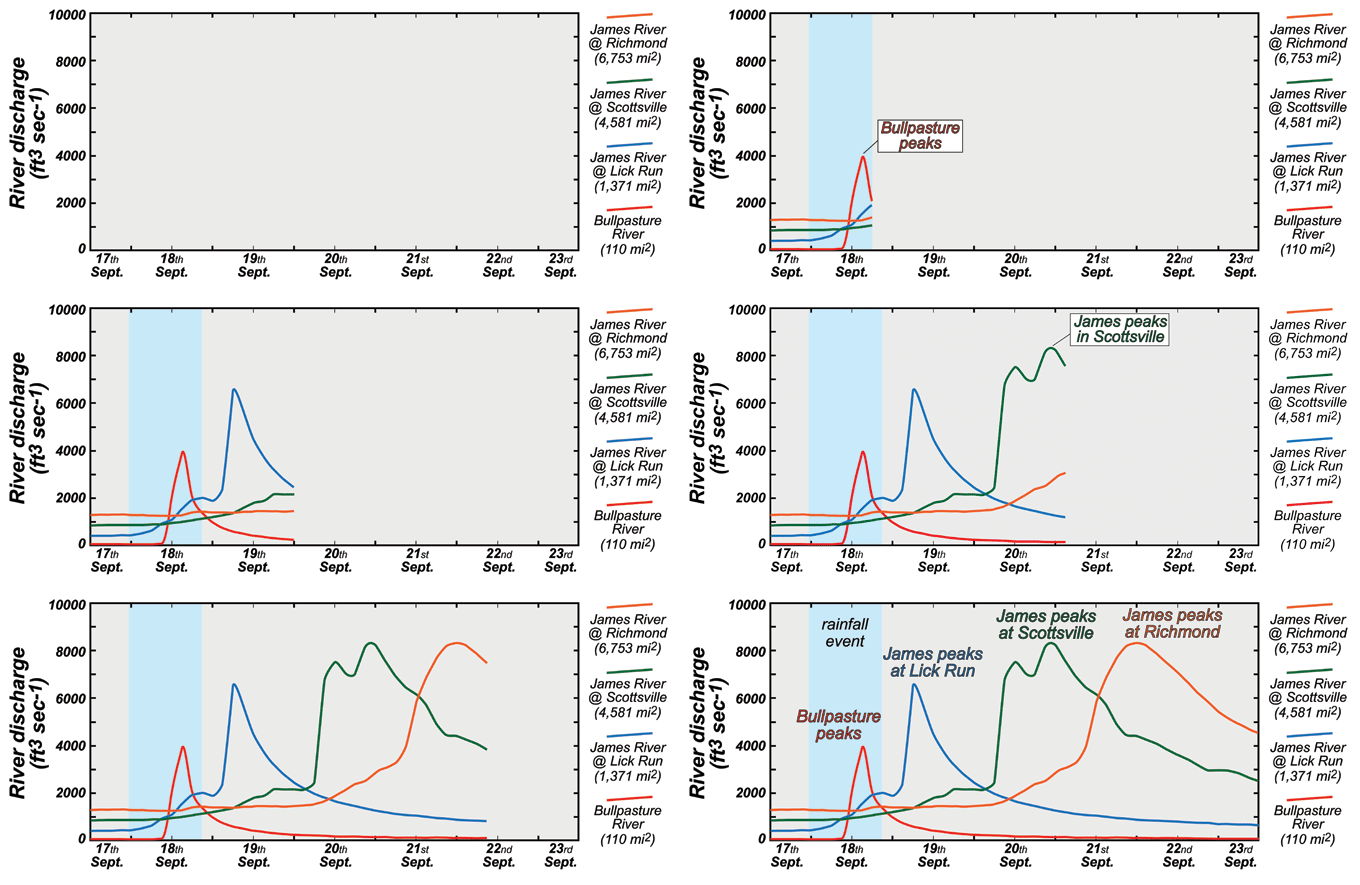
Watch the animated stream hydrograph of four U.S. Geological Survey gaging stations in the James River drainage basin to see the impact of this rainfall event. Before the arrival of the rain, the James and its tributaries were flowing steadily at relatively low late summer flow rates. The rain commenced late on Monday the 17th and continued throughout most of the day on Tuesday. The Bullpasture River, a small tributary stream in Highland County, responded with alacrity. At 9 a.m. on Tuesday the Bullpasture River had about 90 cubic feet of water passing down its channel every second (ft3/sec or cfs), by 3 p.m. the water level in the river jumped up by 5 feet, flow exceeded 4,000 cfs, and the stream was coursing above flood stage.
The rain came to an end on Tuesday evening. By that time flow on the Bullpasture was falling while the James River at Lick Run near Clifton Forge was about to start its climb, topping out at 6,400 cfs in the early morning on Wednesday. All the while, the James continued to flow placidly past the gaging stations in Scottsville and Richmond.
This pulse of water reached Scottsville on the morning of Thursday the 20th. Although the river never reached flood stage in Scottsville, the water rose ~3 feet in less than 3 hours and topped out with a flow of ~8,300 cfs just before midnight. It was mid day on the 20th when the James started a slow and sluggish rise in Richmond. The river continued to rise for over a day, eventually cresting at 11 p.m. on Friday the 21st. With a peak flow of 8,350 cfs in Richmond, the James did not reach its bank full discharge, but was well above the long term median flow.
The river distance between Clifton Forge and Richmond is ~350 km and it took the flood wave* nearly three days (65 hours actually) to traverse that distance. So what’s the average velocity of this pulse rolling down the river? After the river crested, all 4 hydrographs follow a similar trajectory with the flow dropping off exponentially over time. Why is the shape similar and what controls rate at which the hydrograph drops off?
Floods can wreak havoc on riverfront communities, especially if they arrive unannounced. But the surge from a storm through a drainage basin is relatively systematic and predictable. Upstream gage data make it possible to estimate both water height and the arrival time of high water, potentially averting dangerous situations. That’s one of the many reasons the U.S. Geological Survey gages rivers and it is a topic worth studying in the Earth’s Environmental Systems course.
*Although it did not actually flood along most of the James River, the concept is exactly the same.
Comments are currently closed. Comments are closed on all posts older than one year, and for those in our archive.


Shout out to my old DEQ stream gauging buddies! Boy, is it thrilling to see/try to gauge rivers at flood stage. I dont think I even realized how long it took the peak to reach Richmond- great post.
Should’ve timed a canoe trip to ride the flood down the river!