
On Towards the Finish
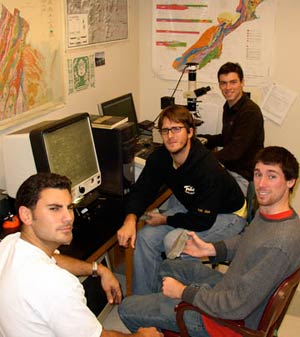
Vorticity research team (minus Lydia Murray) in the lab analyzing samples and scowling at the paparazzi.
As the weather cools and the hours of daylight grow ever shorter, the structural geology seminar finds itself grinding away on the research projects. Perhaps we are not yet close enough to see light at the end of the tunnel (or the semester), but progress has been made. Early in the semester we divided into three research teams, each focusing on a different study area with its own set of geologic problems that need answers. These projects are providing new data with which to better understand the tectonic history of eastern North America. In September, we spent time in the field collecting samples and mapping structures. The rocks are now slabbed, the microscope slides prepared, the data plotted onto digital maps, and the cross sections taking shape.
Team “Vorticity” is taking a multifaceted approach to understand deformation in the Blue Ridge Mountains. Vorticity is a concept derived from fluid dynamics and is the curl of a fluid’s velocity. Under stress and over appropriate time scales- rocks behave as fluids. Structural geologists have co-opted vorticity into the ratio of stretching to rotation that rocks experience while being sheared and distorted.
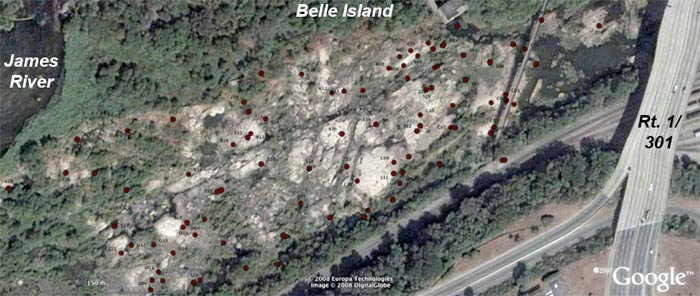
Google Earth imagery of large bedrock exposure south of Belle Island on the James River, Richmond. Red dots are GPS locations recorded while mapping the geology and fractures.
The “James Gang” mapped an expansive outcrop of granite at the Falls of the James River, they are currently deciphering the history of fracturing and faulting in the Richmond area. These granites crystallized deep in the Earth’s crust some 320 million years ago and during uplift to the surface these rocks were repeatedly cracked and broken by tectonic forces. Our efforts are not entirely academic as the geometry of bedrock fractures play a significant role in the flow of groundwater and migration of subsurface pollution.
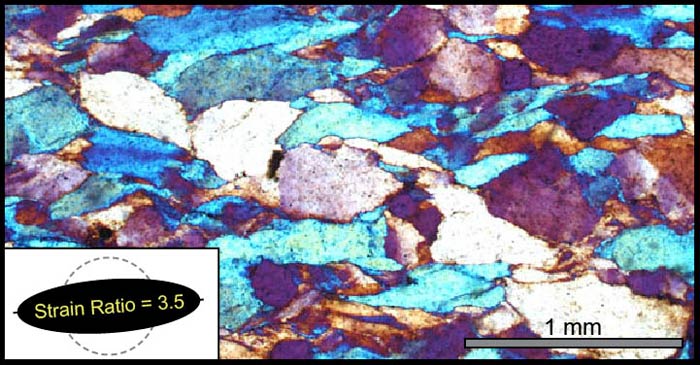
Micrograph of deformed quartz sandstone from the Blue Ridge Mountains. Note that individual grains are generally longer in one direction, prior to deformation individual sand grains would have been approximately equant. Grain shape analysis indicates a strain ratio of 3.5 to 1 for this sample. The rock was vertically shortened and horizontally elongated.
The “Strain Queens” are four ladies with a passion for quantifying just how squashed a sequence of sandstones in Shenandoah National Park became during the tectonic collision that formed the Appalachians. At this point they’ve digitized the centers of so many grains that they’ve lost count. The current point of contention is whether these sandstones experienced flattening strains or lost volume during deformation.
All this work and to what end? Ultimately, we aim to publish the results and communicate the significance of sheared, squashed, and fractured rocks to professionals as well as the public. Our first chance will be at a Geological Society of America meeting in Tampa, Florida during Spring Break. Abstracts for that meeting are due in December, time to go digitize more quartz grains.

No comments.
Comments are currently closed. Comments are closed on all posts older than one year, and for those in our archive.