
Up, Up and Away
Summer is over. Although the astronomical summer lasts until the autumnal equinox in late September, and the meteorological summer has a few more days left (until the end of August) – summer is over for me. Replaced by the realities of a new academic year.
To celebrate summer’s end, I took in one more outdoor adventure to say goodbye to the season – a Sunday afternoon canoe trip around our local estuary, a 10-km loop across the marshy tributaries to the Chickahominy River.

Google Earth imagery of the Chickahominy River and Nayses Bay, southeastern Virginia.
At the far end of the loop I reached the broad expanse of Nayses Bay. All was quiet, except the ospreys that flicked by overhead or dove precipitously into the shallow waters angling for a meal.
In the middle of Nayses Bay I realized that I’m a slacker – a whole summer had nearly passed and I’d not photographed any weather videos. These short 360˚video panoramas of the sky are a staple of my COLL 100 – Weather, Climate, & Change course.
I remedied that in short order.
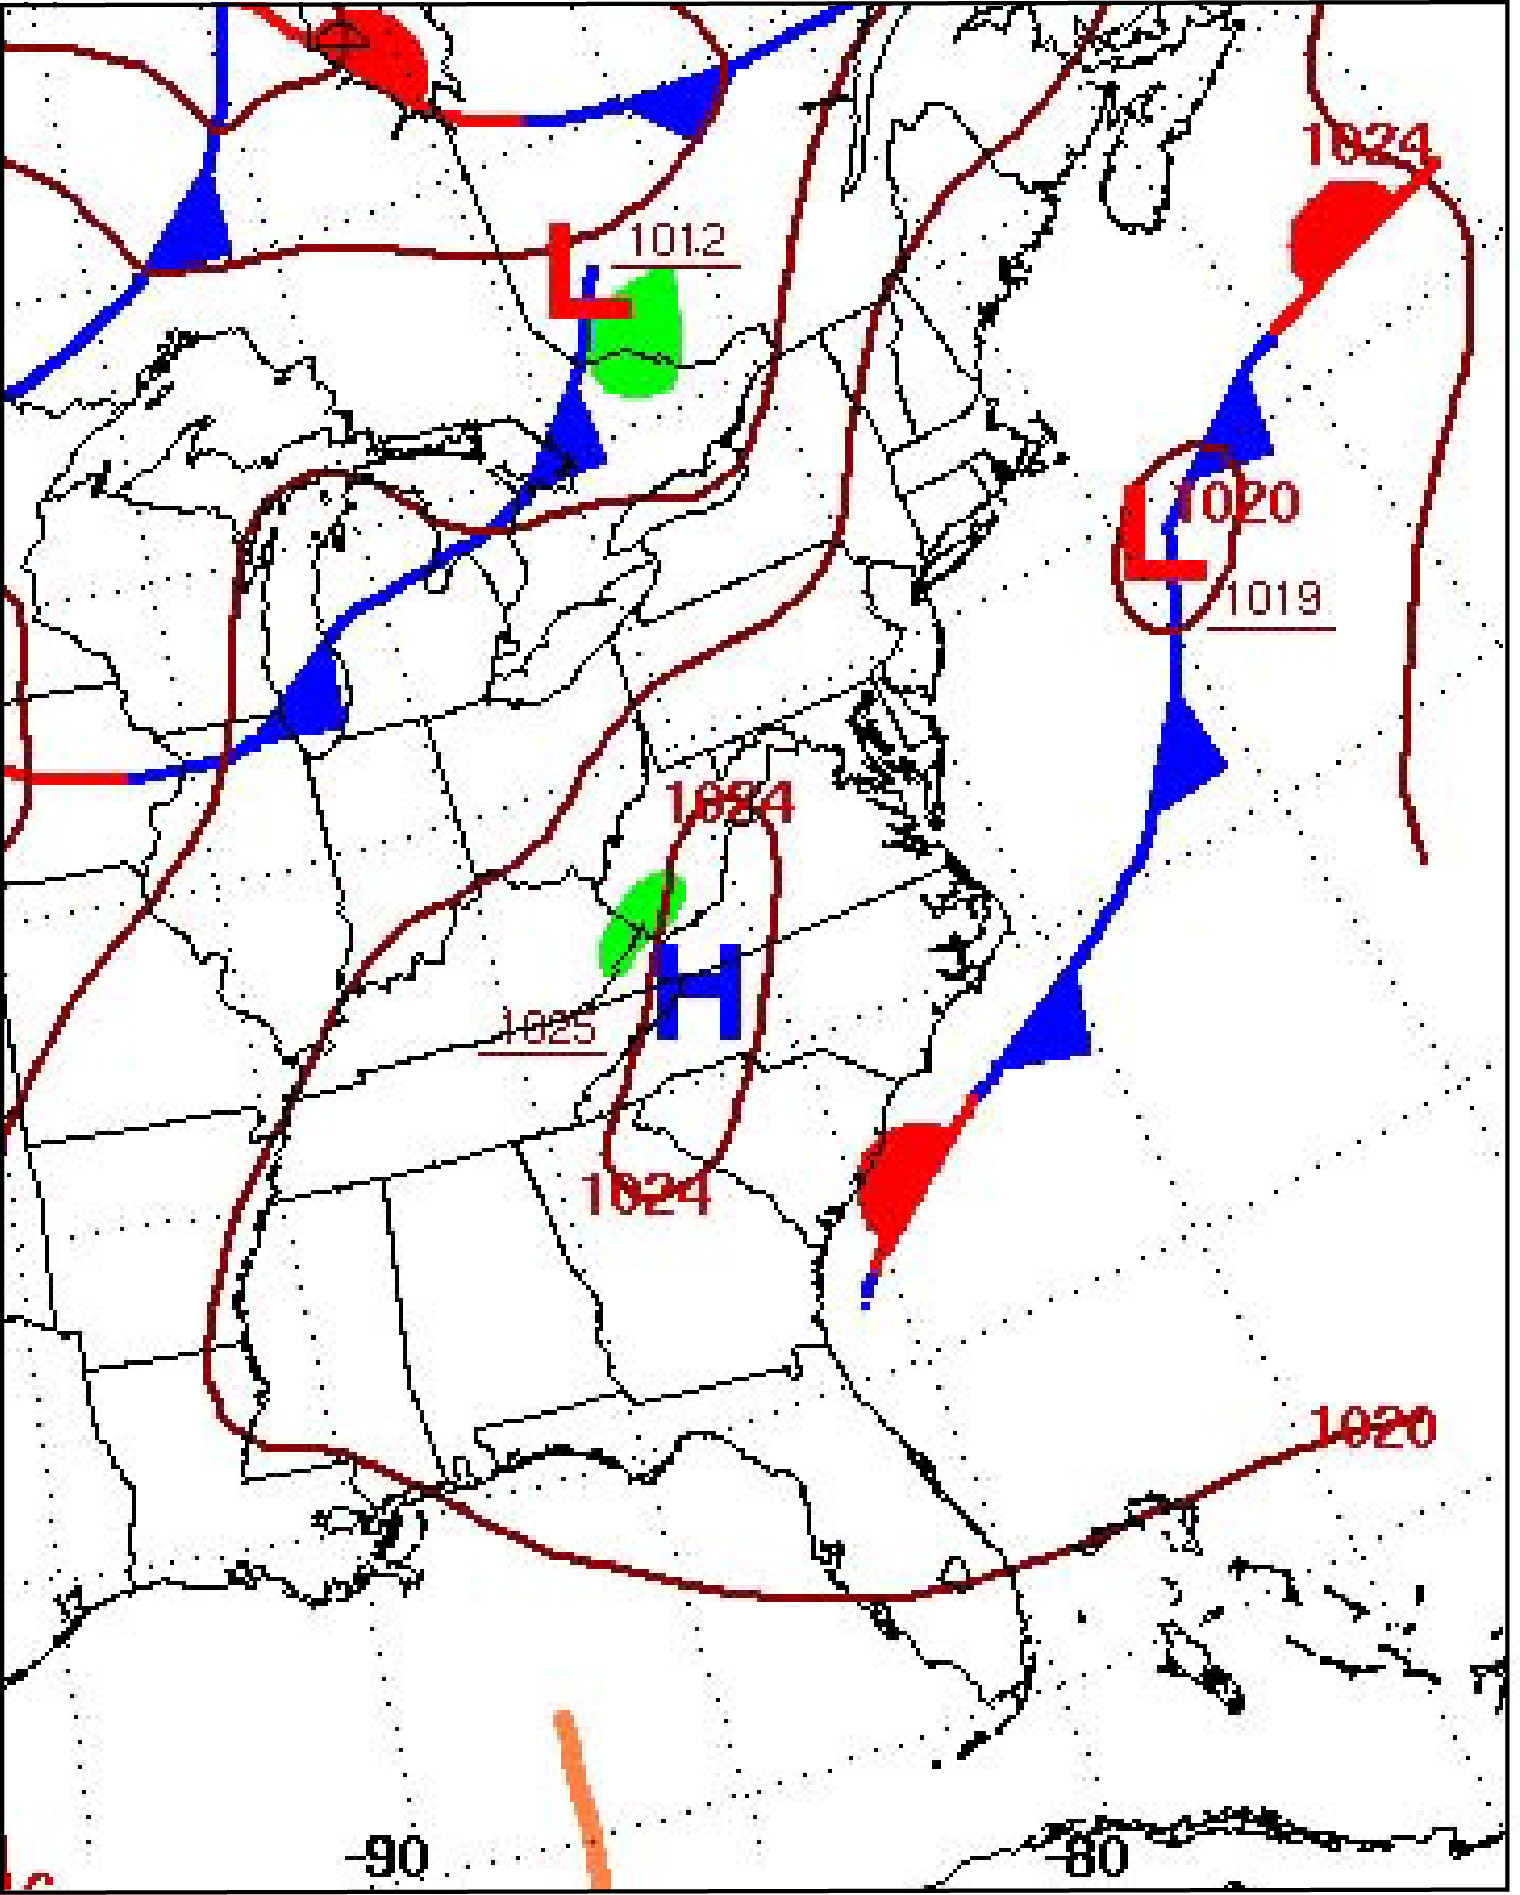
Generalized weather map of eastern United States at 7 a.m. (EDT) on Sunday, August 26th 2018. Map from the National Weather Service.
The 26th day of August 2018 was a good summer day in southeastern Virginia. It was hot enough (29˚ C/84˚ F), but the sky was blue and the humidity was tolerable (dewpoint temp. = 20˚ C/68˚ F). In the video, a hovering osprey is just visible to the southwest. As weather videos go, this one is pretty bland with no real clouds to see and only a gentle southwest wind rippling the waters of Nayses Bay. The Mid-Atlantic was in the gentle grip of a high-pressure system that was slowly moving to the east.
These weather videos are a convenient way to capture the current weather at a particular location, but they don’t provide any broader spatial context like a weather map or an atmospheric sounding.
What’s an atmospheric sounding? It’s vertical measure of atmospheric properties (temperature, dewpoint, wind speed, etc.) typically obtained by an instrument (a radiosonde) attached to a weather balloon. As these balloons rise up, up and away* (sometimes to heights >30 km). The National Weather Service launches radiosondes from many locations, the nearest regularly scheduled soundings to Williamsburg occur at Wallops Island, Virginia’s spaceport on the Eastern Shore. The graph below illustrates the radiosonde data for the Wallops Island balloon launched just a few hours after my foray into the marsh.

Atmospheric sounding above Wallops Island, Virginia replotted from data made available by the University of Wyoming’s Department of Atmospheric Science.
Atmospheric pressure decreases with height (elevation). What’s the dependent variable – pressure or height?
It’s pressure, as atmospheric pressure is controlled by the amount of material (mass) above any given location in the Earth’s atmosphere. The higher up in the atmosphere one travels, the less material there is above you.
Scientific graphs are typically plotted with the independent variable on the X-axis and the dependent variable on the Y-axis. For my graph, I chose aesthetics over traditional scientific practice. It makes sense to put height on the Y-axis, as these balloons really do rise up, up and away through the atmosphere. Plotting these graphs, in this way, makes spatial sense, as well as a more intuitive visual.
W&M’s COLL 100 courses are intended to develop students’ abilities to present and communicate. In Weather, Climate, & Change we’ll delve deeply into crafting effective graphs to illustrate physical data.
Temperature also decreases with elevation. In the first 15 km above the surface, the temperature drops ~95˚ C which averages to an environmental temperature lapse rate of 6.3˚ C/km. At 15 km the temperature levels off, and then begins to modestly increase above 20 km. This thermal boundary (@ ~15 km) is the tropopause, and separates the troposphere below from the stratosphere above.
The blue dots and line illustrate the dewpoint temperature, which is an effective measure of the water vapor contained in the air. For this sounding, the dewpoint temperature is always less than the air temperature – so the air is never saturated. In unsaturated air, clouds don’t form, and thus blue skies prevailed over Virginia on August 26th.
As the new semester unfurls, students in the Weather, Climate, & Change course will come to appreciate weather maps and atmospheric soundings as these data are key to helping predict weather.
*Up, Up and Away is also a suitably trippy song from 1967 by the Fifth Dimension
No comments.
Comments are currently closed. Comments are closed on all posts older than one year, and for those in our archive.