
SNOMI – The Summer Nighttime Outdoor Misery Index
During the summer academic geologists commonly spend time in the field doing research; it’s one of the great things about studying the Earth. I’m fortunate to work on projects from Virginia’s Blue Ridge Mountains to the deserts of Oman, and at many of our field sites we camp while conducting research.
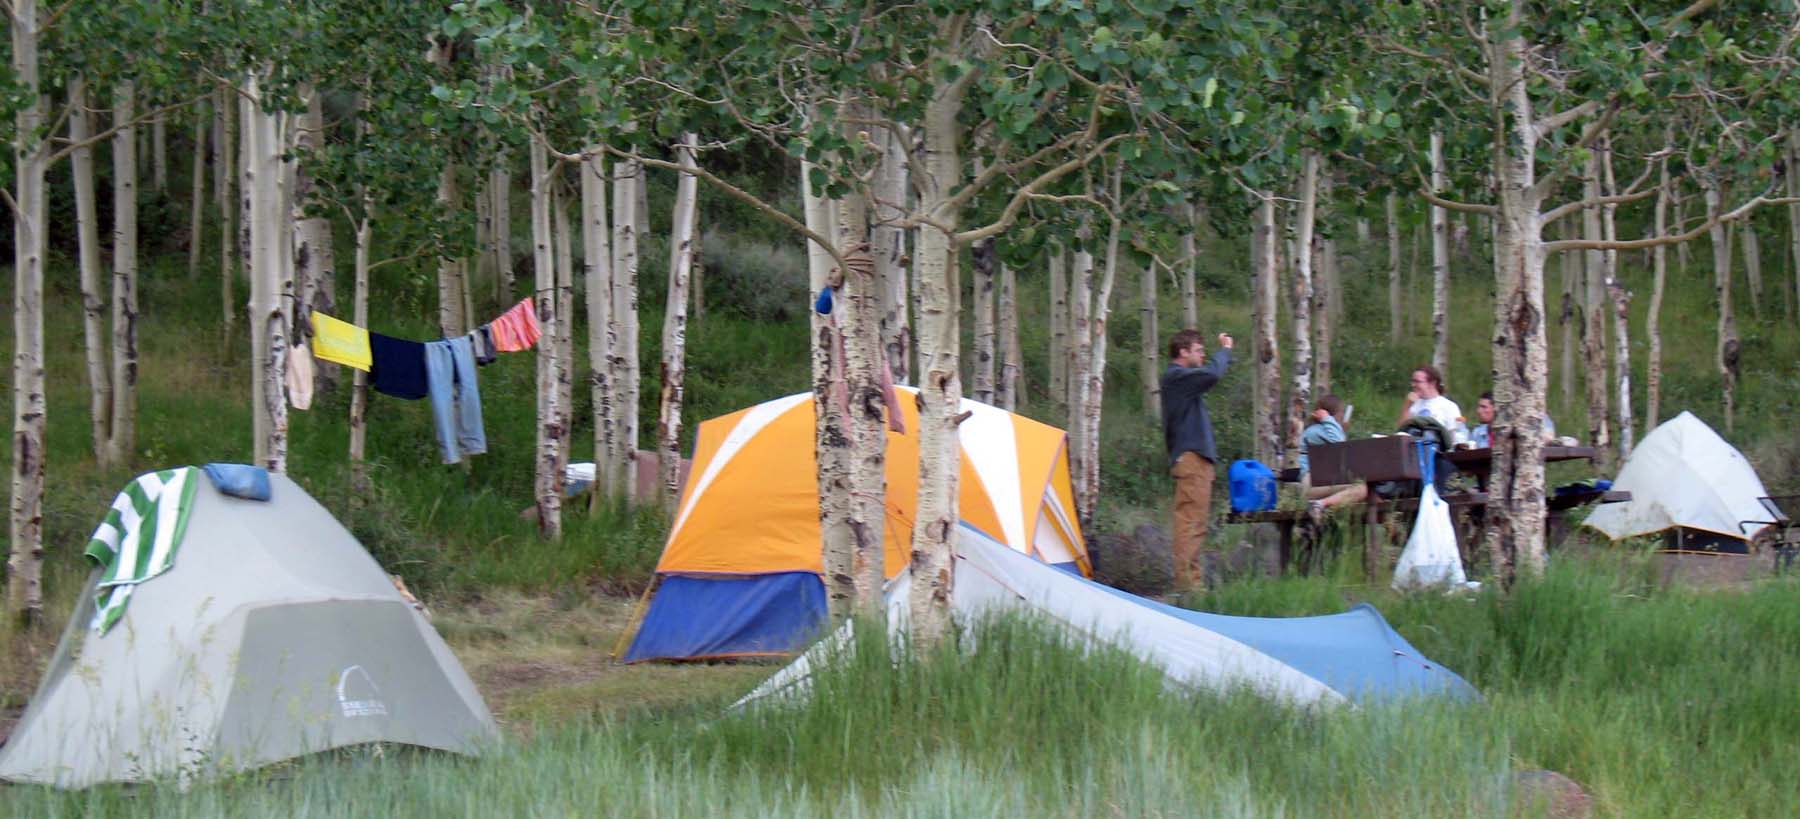
Tents nestled amongst the aspens at our summer base camp, Fish Lake, Utah.
This summer, with the Buckmarlson Banshees, our base camp was near the central Virginia town of Howardsville. Most nights I’d crawl into the tent, lie on top of my sleeping bag, and stare out at the darkness—uncomfortable, cranky, and awake for far longer than I’d like to have been after a day’s fieldwork. Many nights it was miserable to be outdoors.
What conditions make for misery while sleeping outdoors in the summer?
Certainly pesky insects, boorish camping companions, and wayward nocturnal mammals can and do contribute to camping misery, but I’m interested in the meteorological conditions that add up to a poor night’s sleep while in the field.
Air temperature is obvious enough. When it’s too hot, it’s uncomfortable.
Humidity also plays a role, as moist air is cloying and far less refreshing than dry air.
How best to measure humidity? Relative humidity, a commonly used meteorological term, is a function of both the air temperature and the dewpoint temperature (the temperature at which air is saturated with water vapor). Relative humidity varies as a function of air temperature. For example, in the cool early morning hours the relative humidity is typically high, but as the temperature rises during the day the relative humidity decreases, even though the amount of water vapor in the air remains the same. Dewpoint temperature is a better metric for how moist or dry a particular parcel of air is. A dewpoint above 20 ˚C (~68 ˚F) indicates air that’s moist and humid, whereas a low dewpoint, near 0 ˚C (~32 ˚F), is air that’s quite dry.
Collectively, these two factors work together to make things miserable. If both the temperature and dewpoint temperature are high then it’s commonly not good sleeping weather out-of-doors. For instance on June 3rd at 10 p.m., about the time we laid our weary heads to rest, the air temperature in Howardsville was 21.7 ˚C (71 ˚F) and the dewpoint was 18.3 ˚C (65 ˚F): a typical humid and sticky mid-summer night in Virginia.
A quantitative measure of the Summer Nighttime Outdoor Misery Index (SNOMI) could simply involve adding up the air temperature and the dewpoint temperature; for Howardsville on the night of June 3rd that sums to 40.0 ˚C. Compare that with the comfortable night I spent at Fish Lake, Utah on June 10th 2013, when at 10 p.m. the temperature was 16.7 ˚C (62 ˚F) and the dewpoint 1.1 ˚C (34 ˚F), which sums to 17.8 ˚C.

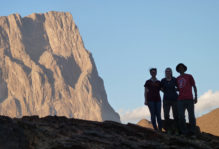
The trade winds freshen things up on Barbados’ eastern coast.
But summing the air temperature and the dewpoint temperature does not adequately encapsulate nighttime misery. As an example, on July 19th 2013 I was near the town of Bathsheba on the eastern coast of Barbados, and at 10 p.m. the air temperature registered a sultry 27.2˚ C (81˚ F) and the dewpoint a hefty 23.9 ˚C (75 ˚F), equaling 51.2 ˚C on my simple additive scale. Yet, it was a perfectly comfortable evening to be outdoors and that’s because the trade winds were blowing a fair and steady breeze at nearly 9 meters per second (~20 mph). Moving air facilitates evaporation, and evaporation is a cooling process that humans use for thermoregulation.
To better quantify nighttime outdoor misery three main factors need to be considered: 1) air temperature, 2) dewpoint temperature, and 3) wind speed. I formulated a numeric relationship that first involves dividing the product of the air temperature and the dewpoint temperature by the square root of the wind speed plus 1, and secondly multiplying that quantity by 0.01. Yikes, that’s a cumbersome sentence; it is far easier to just write out the equation.

SNOMI in equation form. Note when the dewpoint drops below 1˚C the value in the equation defaults to 1˚C.
My unpleasant night at Howardsville came in with a SNOMI of 3.8, while the Fish Lake and Barbados evenings registered 0.1 and 2.1 respectively. I also tabulated data for some of my other travels over the past two summers. The winner (or is that the loser?) was a muggy night in Wachapreague, Virginia at 5.2. From this limited data set I’d argue that a SNOMI of >3 makes for misery.
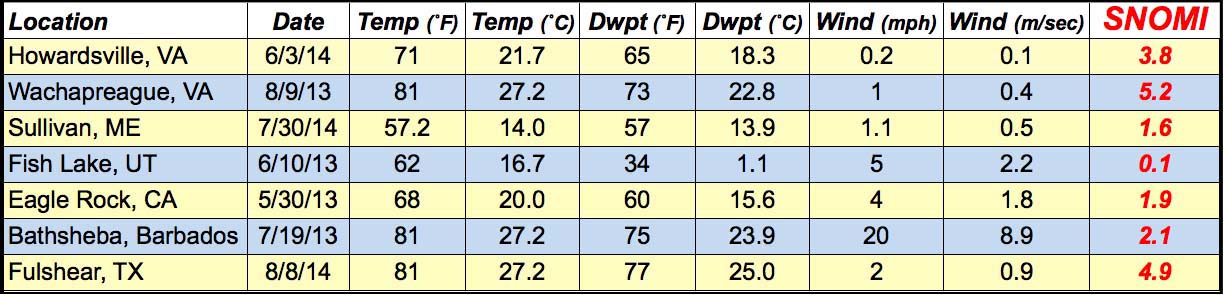
Table data for SNOMI-relevant parameters from my travels over the past two summers.
The 2014-15 academic year starts this week, and one of the courses I’m teaching is our Weather, Climate, & Change course (GEOL 312). As the class explores the workings of the atmosphere we’ll discuss topics like humidity and dewpoint temperature, as well as consider how wind impacts both one’s comfort and the climate.
To get in the proper mood for the new semester I should be asking as many questions as I answer, so here it goes…
- What are the units for SNOMI or is it a dimensionless number?
- In the SNOMI equation why add 1 to the wind speed and then take its square root?
- What are weaknesses in the SNOMI calculation?
- What’s the difference between the commonly used heat index and SNOMI?
- Why go to the trouble of calculating SNOMI, as the National Weather Service dutifully reports the heat index when temperatures exceed 27 ˚C (80 ˚F)?
- Where, globally, would the highest SNOMIs likely occur?

Comments are currently closed. Comments are closed on all posts older than one year, and for those in our archive.
Really great. I like it 🙂
SNOMI is a dimensionless number. The denominator in the equation is set up in such a way that it equals to 1 when the wind speed is zero and goes up when the wind blows more strongly. In this way, when there’s no wind, SNOMI automatically factors out the effect of wind. The higher the wind speed, the lower the SNOMI.
The difference between SNOMI and heat index is that SNOMI takes into account the effect of wind while heat index only uses relative humidity and air temperature to numerically approximate what people feel about the air that they are in.
I remembered that beautiful short film that we watched in the first class of 312 that showed the change of cloud and surface temperature on earth over time. South and Southeast Asia might have the highest SNOMI at this time of the year.
My question is this: does lower temperature always mean a more comfortable summer night? I looked up the average low temperature for Williamsburg around this time of the year and I found it to be in the mid to low 60s, which is an ideal temperature to get nice and cozy.
But what about the cold nights? Record lows are in the mid to upper 40s, and even a temperature approaching 50 degrees would be a little uncomfortable.
Would it be possible to modify the equation so that it accounts for uncomfortably cool nights?
But then again, this is a summer index, so I guess the given equation is meant to apply only to relatively warm nights.
Idk, I just thought I’d give some input.
SNOMI doesn’t seem to account for variable winds or sporadic gusts, just the average wind speed over a certain period of time overnight as reported. I wonder what the range of SNOMI indices could be for any given night and whether it might be more useful to calculate an average SNOMI instead of snapshots at particular points overnight. For example, the SNOMI right now is around a 5.9, but closer to 3am the winds may pick up and bring this value down. Do we take the highest SNOMI value and use this to assess how miserable we were, or is an average of the range a more useful value?
Chris, I think this is an interesting point. It is hard to assign a single SNOMI value to a night when that value only depicts one time during the night. For example, there are some nights that start off stuffy, humid, and generally awful on the SNOMI scale, but then it storms and the night becomes less miserable (or at least miserable in a different way). To get a SNOMI value for the whole date it would seem more logical to average periodic SNOMIs throughout the night. Otherwise, the time the data was recorded should be included in the data table.
It’s all a little too relativistic. Ideals of comfort change from person to person. True enough, a steady cool breeze does make a great night for many a camper, however, for some a breeze may be a cumbersome thing. The environment and circumstances surrounding the zephyr may also change the enjoyment a camper may get from it. Imagine camping on a small island off the coast of Algeria in mid August bracing yourself against the sandy blasts of a Sirocco. The stronger the wind blows the sharper the silica shards slice. Or imagine pitching your tent deep in a fjord on the coast of British Columbia only to be struck by the subzero squalls accompanying a summer squamish. Perhaps not the most comfortable but would end up figuring quite low on your index. Perhaps a better solution would require using a function which takes into account the magnitude aeolian evaporative cooling deviating from an optimum temperature. If the cooling still leaves you too warm or makes you to too cold it would have a similar effect in the calculation.
It also is quite dependent on who you are sharing your tent with and whether or not they were invited or chose to squat in a western wing of your tent without thought of the true tenants…
This is all relative. I fill comfy when it’s dry and chilly and my neighbor likes it hot and humid. I am originally from Northern part of EU and he is from Belize. He’s wearing a sweater when I’m in t-shirt. I feel like this equation is missing something – a factor of the country of origin, perhaps?