
Hark Upon the Gale! The Hurricane Irene Report
Hurricane Irene raked North America’s East Coast and put a kibosh on the start of William & Mary’s Fall semester. Students were sent packing to safer locales while most faculty and staff hunkered down in Williamsburg. Irene delayed opening convocation by a week, but last Friday the choir belted out a spirited version of William & Mary’s school song- James Southall Wilson’s “Our Alma Mater”- and the semester was truly under way.
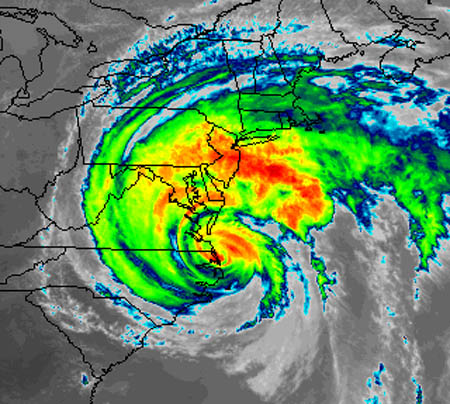
Enhanced infrared satellite image of Hurricane Irene at 5 p.m. (EDT) August 27th, 2011. (From- http://www.ssec.wisc.edu/~scottb/110825-29_g15_ir_irene_anim.gif)
For my money, the best line in the song is “Hark upon the gale!” There are varied interpretations as to what “hark upon the gale” really means- I view hark as an active rather than a passive verb. During Irene the Geology faculty did more than just listen to the gale- they were out in the gale collecting data before, during, and after the event.
On Friday afternoon the W&M campus was quiet, but the atmospheric pressure had started its telltale decline. By the wee hours of Saturday morning, August 27th the wind was blowing steadily from the east and the rain began. Professor Greg Hancock measured the cumulative precipitation at his house- in the early afternoon the rainfall rate exceeded 1” per hour, deluge-like rates! By noon the wind was coming from the northeast, and as the Hurricane’s center moved to the northeast off Virginia’s coast, the wind steadily shifted from the north to the northwest and then to the west. Sustained winds at Yorktown ranged from 15 to 23 m/sec (~30 to 50 mph) with the peak gusts, at nearly 30 m/sec (66 mph), occurring near midnight. These winds blew down trees and shut off the power to most Williamsburgers.
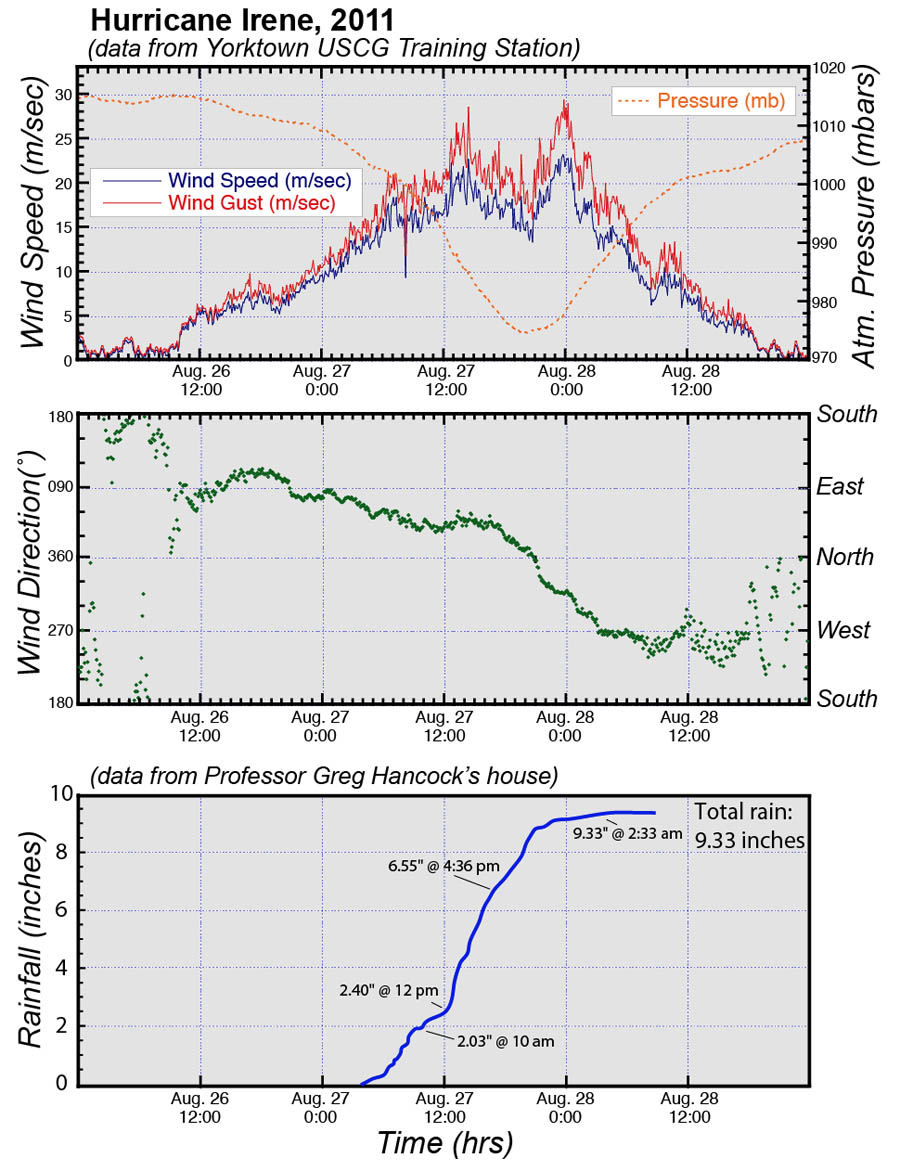
Data plots for Hurricane Irene in the greater Williamsburg area.
At his house near York River State Park Professor Jim Kaste was monitoring a small perennial stream and collecting water samples for chemical analysis. The normal base flow for the stream is quite small (<0.01 cubic feet/sec), during the height of Irene stream flow exceeded 6.5 cubic feet/sec- more than two orders of magnitude (>100x) greater than normal flow! Even a week after the storm, the stream has yet to fall to its base flow condition. His environmental geochemistry class is now running the water samples to measure the dissolved load carried by the stream and assess what fraction is derived from Irene versus groundwater.
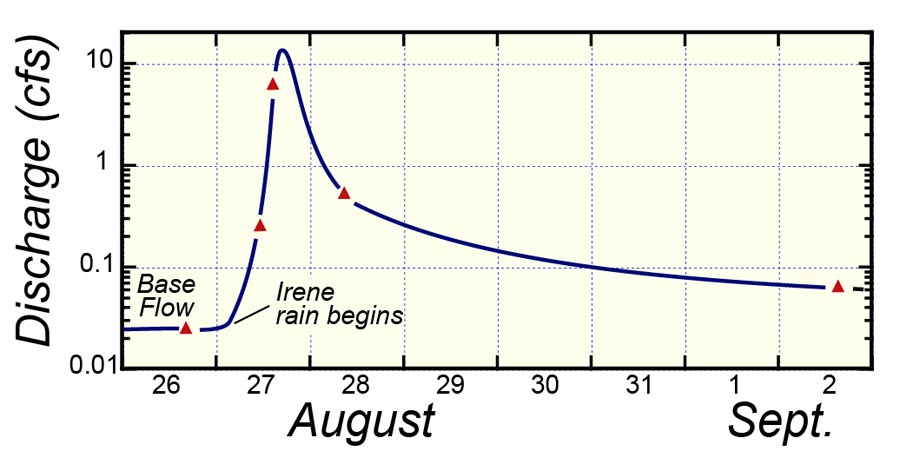
Discharge of a small stream near York River State Park. Note logarithmic scale.
On Sunday morning the damage from downed trees was widespread. I lost two trees to the storm, but none fell on the house- my next-door neighbor was not so fortunate. In between chain sawing and cleaning up I measured the orientation of the blown over trees in my neighborhood and then later on campus and around Williamsburg. The orientation of the downed trees tells a story about the kinematics of the wind during the storm. There is a clear bimodal pattern- the majority of the trees fell towards the southeast and southwest. Almost no trees fell toward the west, northwest, north, and northeast.
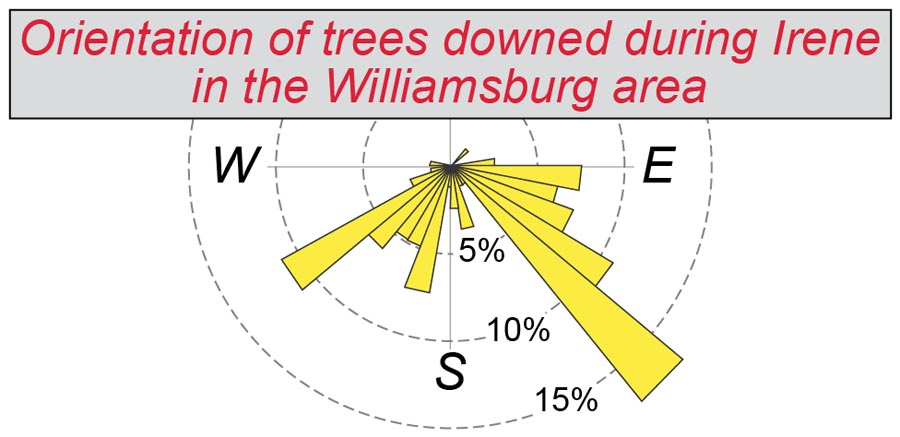
Rose diagram illustrating the orientation and % of downed trees. Note- this is a map view.
Prior to Irene’s arrival I’d hypothesized that most trees would fall towards the west and southwest as winds from the east and northeast (on the leading edge of the storm) would do the damage. As rose diagram illustrates my hypothesis was generally incorrect.
Incorrect hypotheses warrant further inquire so I decided to investigate the dynamics of the wind, leading me to calculate the cumulative wind energy for winds from various directions during the storm. Utilizing the wind data from the Yorktown Coast Guard station, I sorted the wind data into directional bins (in 10˚ increments) then for each observation determined the wind power acting over 1 square meter via this relationship:
Power (in Watts) = 1/2 x (air density) x (area) x (wind velocity^3).
I used a standard density for air of 1.225 kg/m3 and an area of 1 m2. Here is an example calculation-
1/2 x (1.22 kg/m^3) x (1 m^2) x (10 m/sec)^3 = 612 kg m^2 /sec^3 = 612 Watts
Wind measurements were made every 6 minutes, so to convert to energy I multiplied the power by 360 seconds (the number of seconds in 6 minutes). Power is energy per unit time, so to get energy from power- multiply by time. I then summed each 6-minute interval for a given bin to yield the cumulative wind energy from each direction.
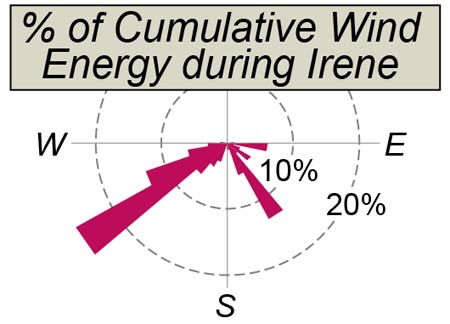 Well over 60% of the cumulative wind energy came from the northeast (that is wind blowing towards the southwest) while the cumulative wind energy from the northwest is markedly lower. This is likely because the wind blew consistently from the northeast for many hours (see the wind direction plot above). The correlation between the orientation of downed trees and directional wind energy is less than stunning. Perhaps there is a better metric for understanding the downed trees.
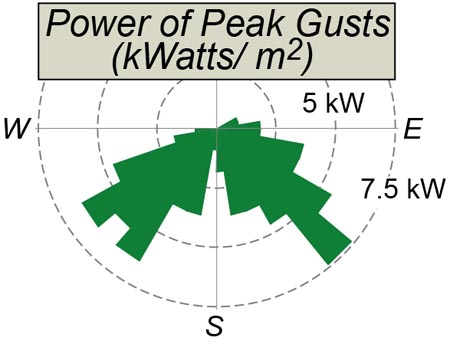
The next step was to calculate the power (in kWatts per square meter) from the peak gusts from a particular direction. This yielded a bimodal pattern with peaks in both the southwest and southeast quadrants- much closer to the observed tree fall data. It seems reasonable that the peak winds toppled trees.
Another significant observation is that most trees fell during the last half of the storm. Although the energy and even peak gusts coming from the northeast (first half of the storm) were high, more trees fell due to winds from the northwest (last half of the storm). It had been dry for some weeks in Williamsburg and it took time for the rainfall to saturate the soil, and saturated soils are invariably less cohesive and weaker than dry soils.
Hurricane Irene was an exciting event for the William & Mary earth science community. Collectively, the storm damage to campus and the community was modest- that is a good thing. Although many were disappointed with the media’s hype of the storm, Irene tracked out just as meteorologists had predicted. In Williamsburg Irene was an asymmetric storm with copious rain in its long opening act and a tumultuous windy finish. The storm set the tone for the early days in my Weather, Climate, and Change class. As the Fall semester unfurls, Geology faculty and students will continue to work out the intricacies of Irene’s environmental impact .
So as the song says… “Hark upon the gale! Hear the thunder of our chorus”

Comments are currently closed. Comments are closed on all posts older than one year, and for those in our archive.
Chuck! You’re giving all of the problem set answers away online now?
Drew! No so fast… hints yes, but just why do we cube the velocity to get wind power?
Ah yes – have you already asked your class this question?
Say the wind is moving at 1m/s. That means one meter of air is passing through your m^2 space every second. Along the way, the entire VOLUME of air is acting on the plane. Therefore, velocity needs to be cubed to reflect the three dimensional nature of the gas exerting a force on the tree!
Did I pass?
Indeed, you’ve passed and the GEO 312 class should thank you.
Hey Drew,
While you’re at it, when calculating solar insolation….
Thanks Drew!
Lovin’ the shout-out to the Choir, Chuck. 🙂 Alma mater hail!