
A Hard Freeze in the Basement: The Earth Structure & Dynamics Field Trip 2016
The Earth Structure & Dynamics class field trip is an annual rite of spring; when early April arrives it’s time for our weekend trip to explore the geologic structures of the Piedmont and Blue Ridge regions. A week ago Saturday, we were rolling deep with 36 students and two TAs. We departed from Williamsburg on a bright and breezy morning, with the temperature at 8˚ C (47˚ F); it’d be the highest temperature we’d experience for the whole trip.
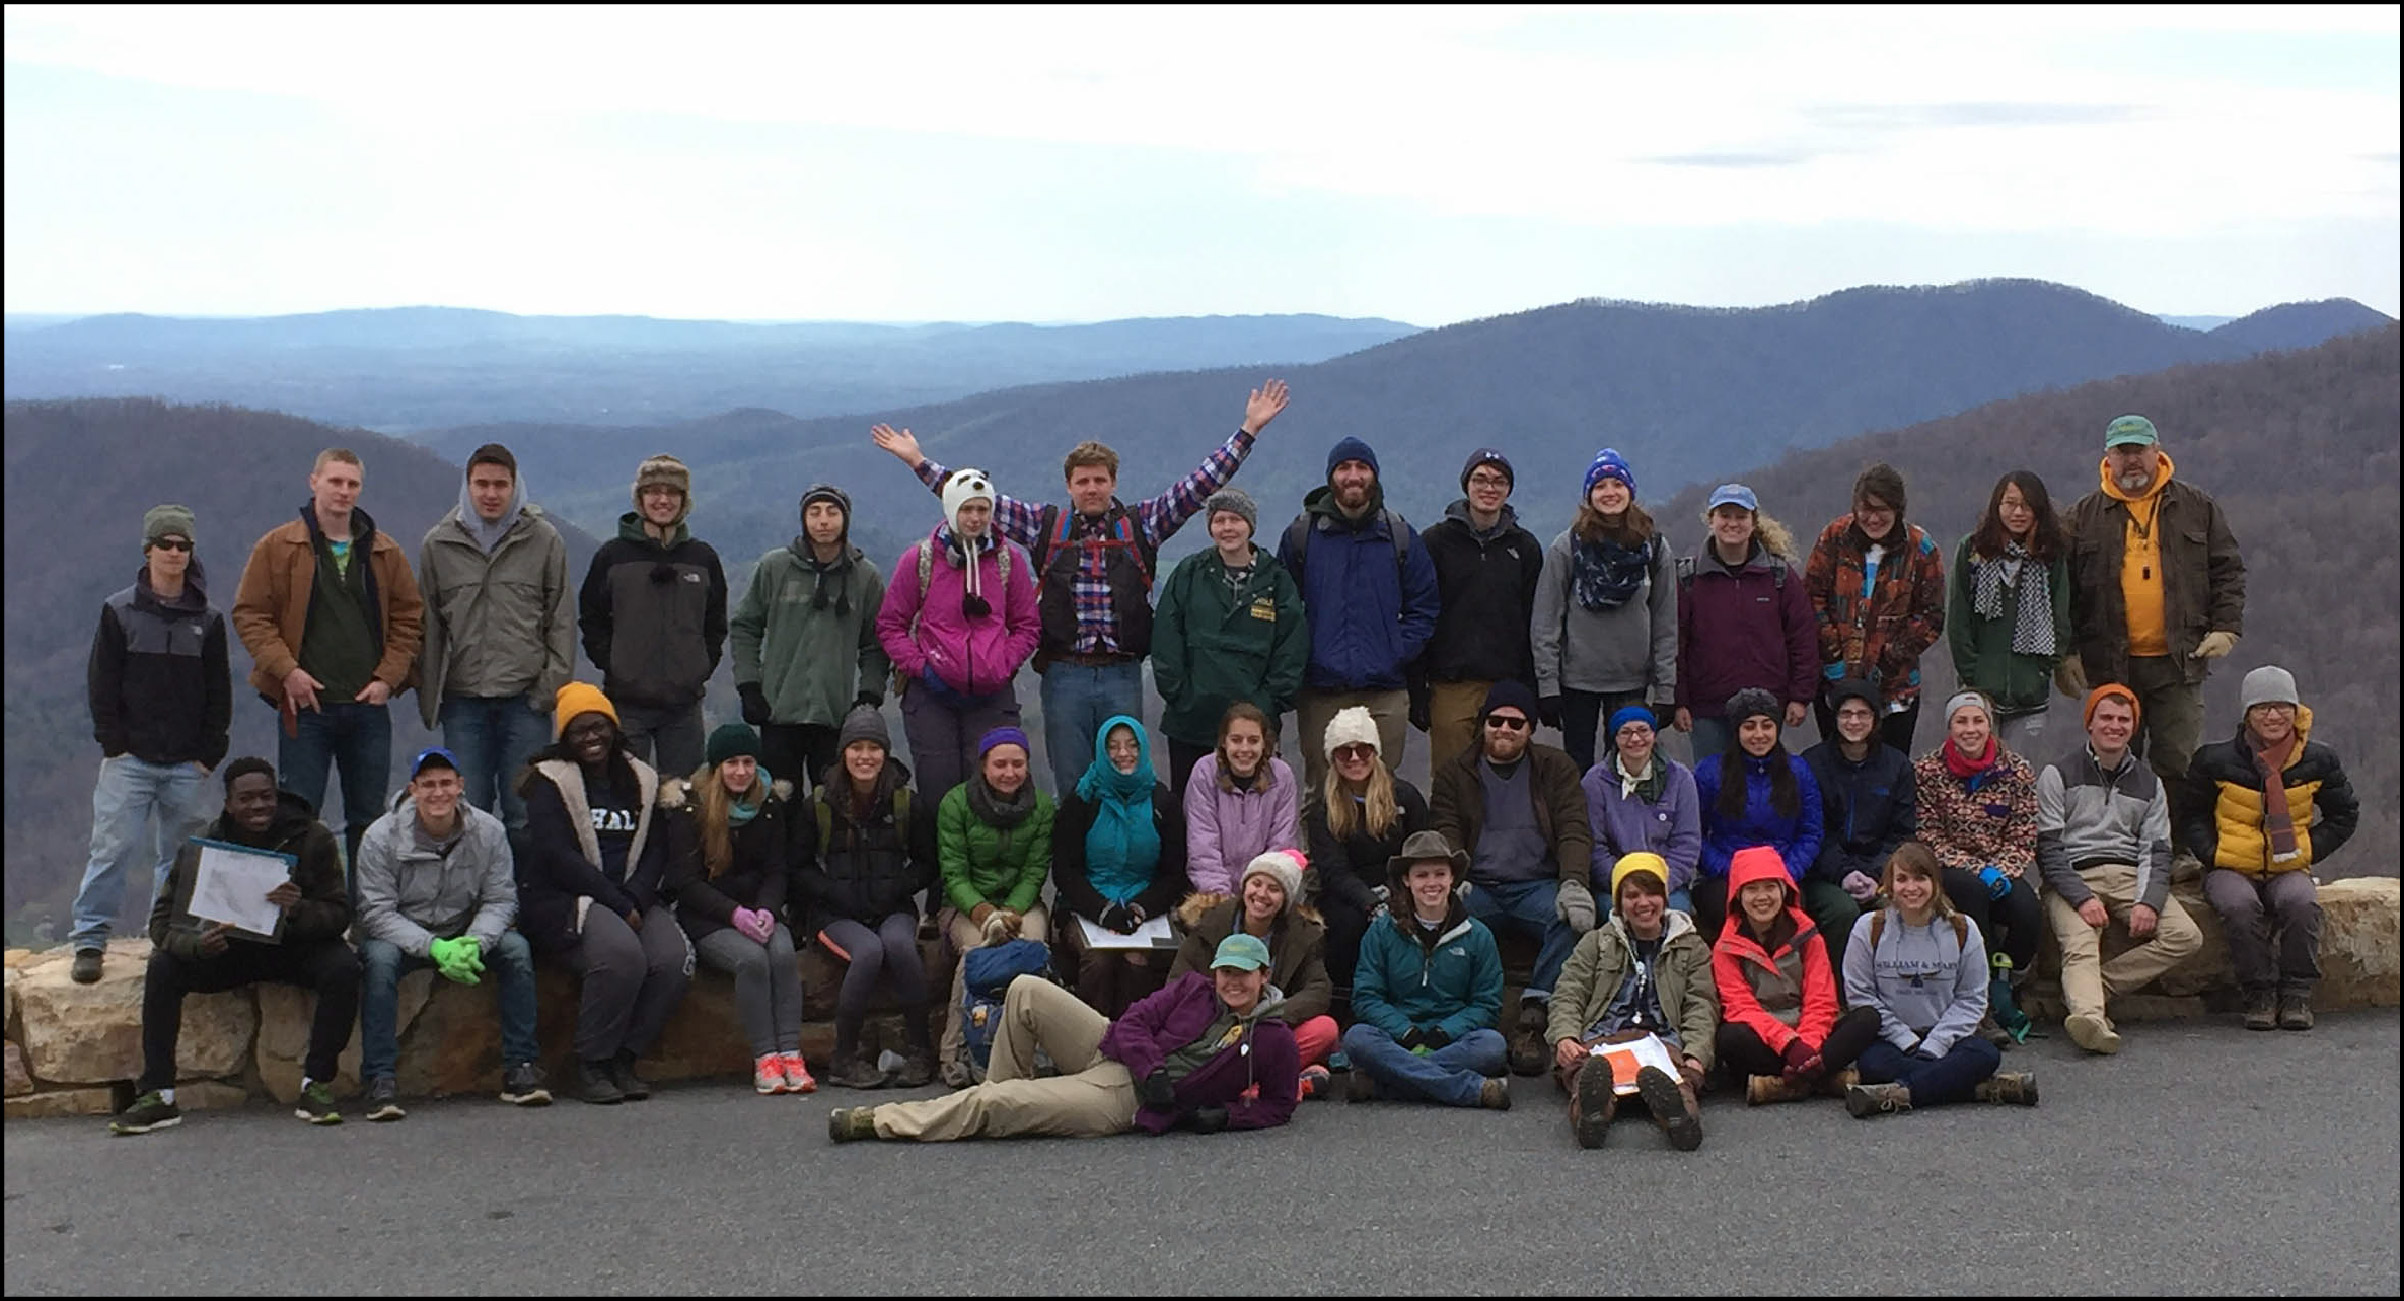
The 2016 William & Mary Earth Structure & Dynamics class at Loft Mountain Overlook in Shenandoah National Park after a cold night in the Blue Ridge Mountains.
Why take a whole weekend, during a busy time in the semester, to go see rocks in the field? The simple reason is this: the earth is the primary source of data for geoscientists, and making cogent observations and reasoned interpretations in the field are not easy. Becoming proficient in the field requires practice – the more the better.
On this trip, students practice doing geology in the field, and along the way decipher the long tectonic history of the Appalachian Mountains. Students worked in teams of three and gave themselves a slew of clever team names, including Team Hammer Time, Team Pomi-Granites, the Cambrian Crew, and Team Easy Breezy Boudinage (just to name a few). When we arrive at an outcrop, the students eagerly debouch from the vans, and I hand out worksheets filled with an array of geologic questions. Teams work through the questions: observing the rocks and measuring geologic structures. After the work is complete, I collect the worksheets and we discuss our answers and then try to place the local outcrop into a broader regional tectonic framework.
As we headed into the Blue Ridge foothills the sky was filled with scudding clouds bringing snow flurries and a righteously cold northwest wind. The temperature struggled to stay above 6˚ C (40˚ F). We enjoyed an epic stop at the Garth Run high-strain zone near Madison, Virginia. This is an ancient fault zone where the old granitic basement rocks that undergird the Blue Ridge were transformed into mylonitic rocks, by processes that happened when these rocks were buried deep in the crust and hot enough (~400˚ C) to flow when stressed.

Undeformed granite (left) that was transformed into mylonite (right) in the Garth Run high-strain zone, a 100-m thick high-strain zone in the Virginia Blue Ridge. The magenta circle represents the undeformed state in the granite (left) that is transformed by homogeneous deformation into an ellipse (right).
The high-strain zone was well exposed by debris flows that roared through Garth Run on June 27, 1995, eroding the stream bank and laying bare the underlying rocks. I first started studying this zone after I arrived at William & Mary as a new professor in 1996. Twenty years later there are trees growing from the bedrock, but it’s still a wonderful exposure and hundreds of William & Mary geologists have visited this outcrop.
Illustrated below is the worksheet that I laid on the students at Garth Run. It’s got a range of questions:
- observations and measurements – these are things that every structural geologist should be able to do
- kinematic interpretation – this asks students to determine the direction and style of tectonic movement recorded in these deformed rocks
- interpretation questions – these are questions that cannot really be answered on the outcrop, but are meant to be thought-provoking and up for debate

The Garth Run high-strain zone worksheet.
Observations and measurements
Take a look at the results of the foliation and lineation measurements made with the Brunton compass. These data are plotted on a stereogram – a diagram that illustrates three-dimensional data in two-dimensions. There is one stereogram per team; I wanted the teams to plot their own data back in camp after dinner, but the wind and the cold conspired against my plan and the students took to making s’mores by the roaring campfire!

Stereograms from each teams’ structural measurements at the Garth Run high-strain zone, Virginia with my commentary on the quality of their measurements. The gray great circle is the orientation of the mylonitic foliation and the blue diamond is the orientation of the lineation. Plots were constructed using Stereonet (ver. 9.5.3) by Richard Allmendinger.
Nearly all the teams made accurate measurements of the foliation which strikes to the north and dips ~40˚ to the east. The results are less good for the lineation data – the lineation lies in the plane of foliation and at Garth Run plunges down the dip, so the blue diamonds should plot on the gray great circle (foliation) above. Practice makes perfect, and it’s clear the class needs more practice measuring lineations. To be fair, 2/3s of the class got it right or were close – I’d wager that most undergraduate structural geology classes would not do as well.
Kinematic interpretation
The orientation of the foliation and lineation are important for working out the kinematics of deformation; the lineation represents the direction in which these rocks were most elongated, while the foliation forms at right angles to the direction of maximum shortening. Traditionally, the “sense-of-shear” is discerned by examining the plane perpendicular to foliation and parallel to the lineation and looking for asymmetric structures.

Micrograph of a Garth Run mylonite, Blue Ridge province, Virginia. Section is parallel to the lineation and perpendicular to the foliation. Note the top-to-the-west asymmetry, indicative of west-directed shearing. fp- feldspar porphyroclast, m- muscovite, a metamorphic mineral that crystallized during deformation.
The mylonites at Garth Run are more complex, and preserve asymmetric structures on both the lineation parallel and lineation normal faces. I’ve interpreted these rocks to have experienced a triclinic deformation, with the hanging wall of the Garth Run high-strain zone moving westward, up and over the footwall as an oblique reverse fault.
Interpretation questions
When did the Garth Run high-strain zone slip and slide? We know the protolith for the mylonitic rocks are the ~1 billion year old granites from the Blue Ridge basement complex, so deformation occurred sometime after a billion years ago, but that’s pretty awful temporal control. The range of answers from the teams was impressive: 3 teams argued for Proterozoic deformation (older than 550 Ma), 8 teams posited deformation during the Paleozoic (between 550 and 250 Ma), and 1 group made the case for Mesozoic deformation (between 250 and 65 Ma).
As I noted above, this is not a question that can be answered in the field; a better question might be:
How could the age of deformation be determined?
We debated that topic in the field, and agreed that the age of metamorphic minerals, such as muscovite, in the mylonite should be determined. Muscovite contains potassium, and some of that potassium is radioactive (40K) and over time decays to argon (40Ar). In 2005, Katie Wooton (W&M Geology class of 2005) did just that for her Honors thesis. Working with Mick Kunk at the U.S. Geological Survey Katie determined that the muscovite cooled below it’s closure temperature between 330 and 340 million years ago. This is the cooling age, which is the time since the mineral cooled below it’s closure temperature – the temperature at which the potassium and argon atoms effectively stop diffusing out of the mineral.
For the Garth Run mylonites, Katie’s age date likely records the end of deformation for this high-strain zone, and we interpret this shear zone to have been active during the Neo-Acadian orogeny, an interval of continental deformation that occurred in the central and southern Appalachians during the Late Devonian to Mississippian periods.
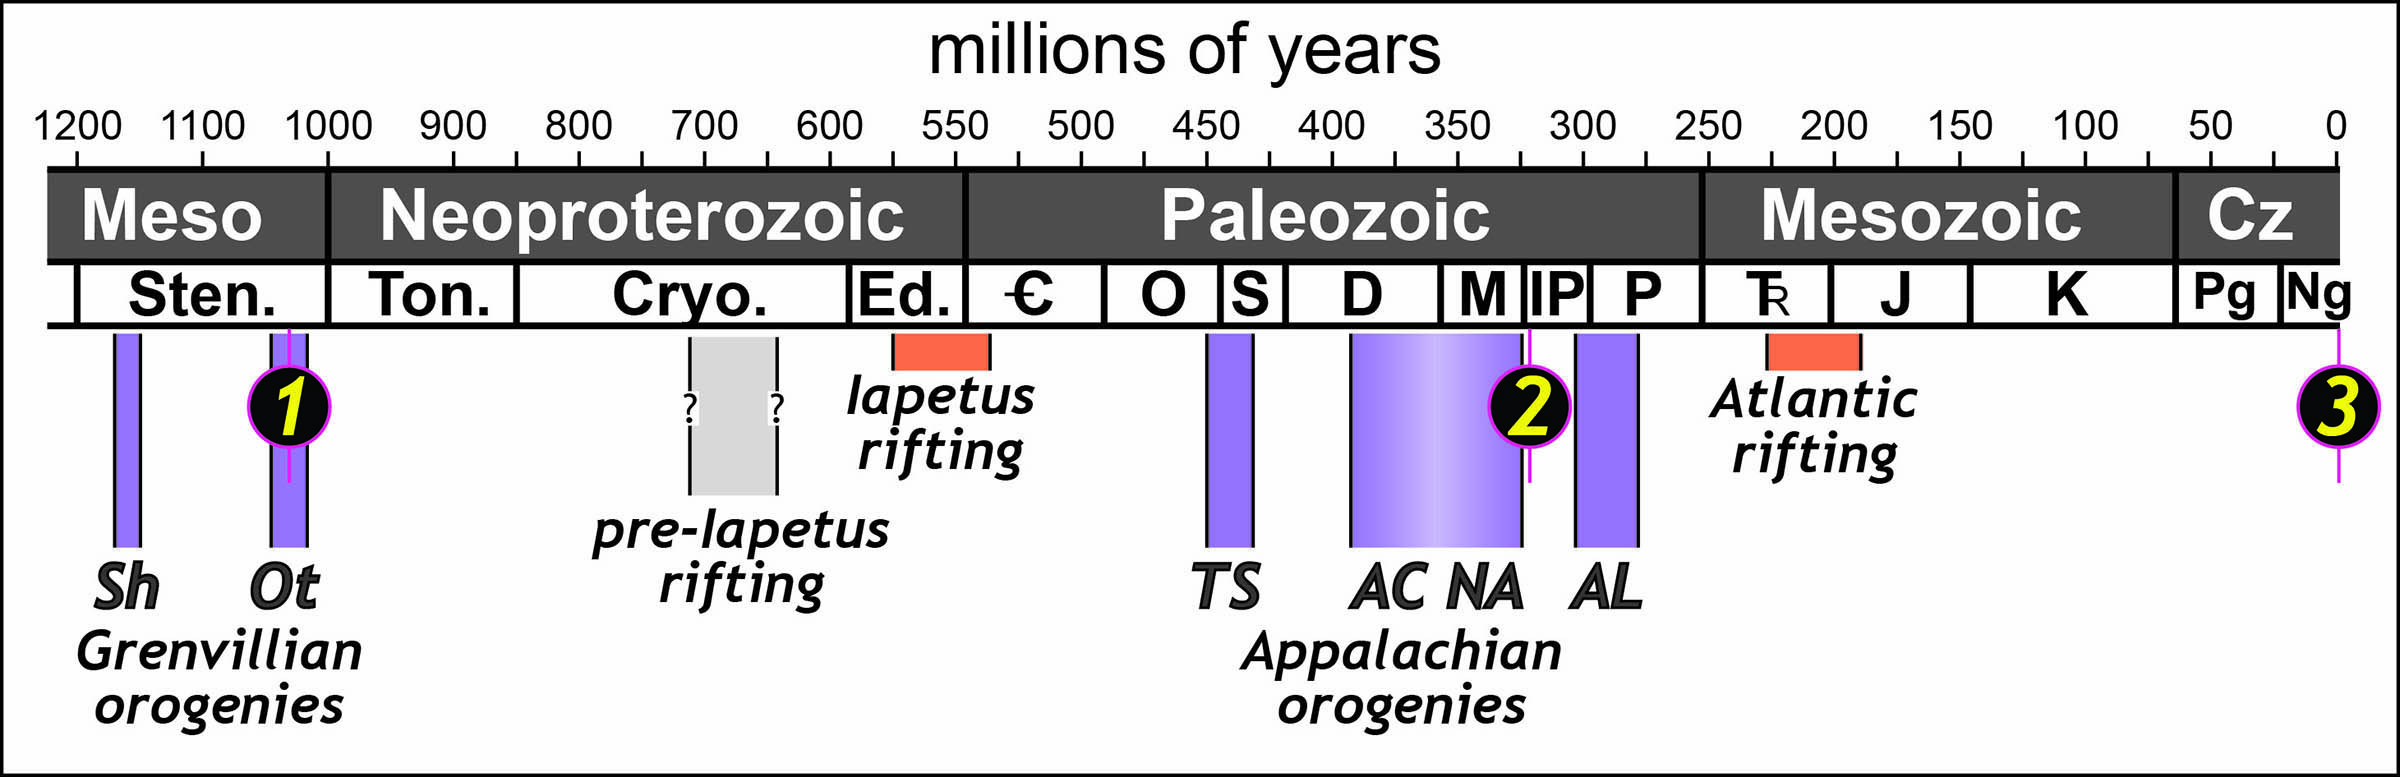
A geologic timeline for the Garth Run high-strain zone. 1) intrusion of the granitic basement @ 1,065 Ma, 2) deformation and mylonite formation @ 330 – 340 Ma, 3) William & Mary geologists arrive at Garth Run @ 0 Ma. Orogenic events: Sh—Shawingian; Ot—Ottawan; TS—Taconic-Salinic; AC—Acadian; NA—Neo-Acadian; AL—Alleghanian. Modified from Whitmeyer, Bailey, and Spears (2015).
Now we know the age of the Garth Run fault zone, but how long did it take to transform the granitic rocks into mylonites? Once again this question cannot be answered in the field, but it’s a delightful touchstone for debate and conversation (say, around the campfire).
Geologists often sing the mantra ‘the present is the key to the past’, and that’s just what we’ll do. Using Global Positioning System (GPS) time series data geologists can measure the rate at which active tectonic processes, such as the collision of India with Asia or sea-floor spreading in the Mid-Atlantic Ocean, are taking place. Strain Rate, the rate at which deformation takes place, is the amount of deformation divided by the time it took for deformation to occur.
Strain Rate = Amount of Deformation/ Time for deformation to occur (1)
Modern tectonic deformation occurs at rates between 1 x 10-12 sec-1 and 1 x 10-15 sec-1 (strain rate may seem a funky term, strain is a dimensionless number, therefore the units for strain rate come out to be reciprocal seconds; it’s spoken as 1 x 10-13 per second). Flow in the Earth’s mantle creeps along at the sluggish rate of 10-14 to 10-15 sec-1, whereas active faults and ductile shear zones may chug along at rates of 10-12 to 10-13 sec-1.
Let’s assume that the Garth Run high-strain zone behaved similar to modern deformation zones and that deformation accrued at a rate of ~1 x 10-13 sec-1. We can also estimate the total amount of strain in the Garth Run mylonites by determining the aspect ratio of deformed grains such as quartz ribbons and boudinaged feldspars. A quick estimate indicates the rock’s been elongated (parallel to the lineation) by at least 300% (or 3.0 when not written as a percentage- recall strain is a dimensionless quantity.)
Let’s rearrange the strain rate equation to solve for time:
Time for deformation to occur = Amount of Deformation/ Strain Rate (2)
Now plug in our estimates and solve the equation:
Time for deformation to occur = 3.0 / 1 x 10-13 sec-1 = 3.0 x 10¹³ sec
That’s a lot of seconds, so let’s convert the answer to years:
3.0 x 10¹³ sec / (3.15 x 10⁷ sec yr-1) = ~950,000 years
So based on this simple calculation, deformation in the Garth Run high-strain zone may well have taken place in about a million years. A long time from a human perspective, but in the realm of geologic collisions between continent-sized blocks, just a brief skirmish across a long front.
We finished our work at Garth Run, and made our way to camp at the base of the Blue Ridge Mountains (also in the granitic basement complex). After the sun set the wind abated and stars appeared, however it was going to be a cold night. By morning a hard freeze was upon us, and the temperature bottomed out at -3˚ C (27˚ F). Needless to say, there were quite a few cold W&M geologists- eager for hot drinks, hard boiled eggs, and toasted bagels.

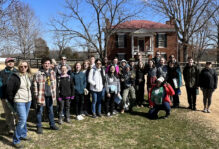
Bundled up against the weather! William & Mary geologists working it out at the Garth Run high-strain zone.
On Sunday we headed to the high country in Shenandoah National Park, and took in outcrops along the Skyline Drive. The day was fine, and the temperature slowly rose – here we examined rocks in the Blue Ridge cover sequence (the rock sequence above the basement complex) that tell the story of rifting and continental breakup, but I’ll leave tale for another post.


No comments.
Comments are currently closed. Comments are closed on all posts older than one year, and for those in our archive.