
Explorations in Time-Depth Space: The Earth Structure & Dynamics Field Trip 2017
The Earth Structure & Dynamics class field trip rolled west from Williamsburg to the Blue Ridge Mountains on a near perfect early spring weekend in late March. Once again it was time for our annual class field trip to examine rocks and structures in the field and make sense of the Appalachian orogen.
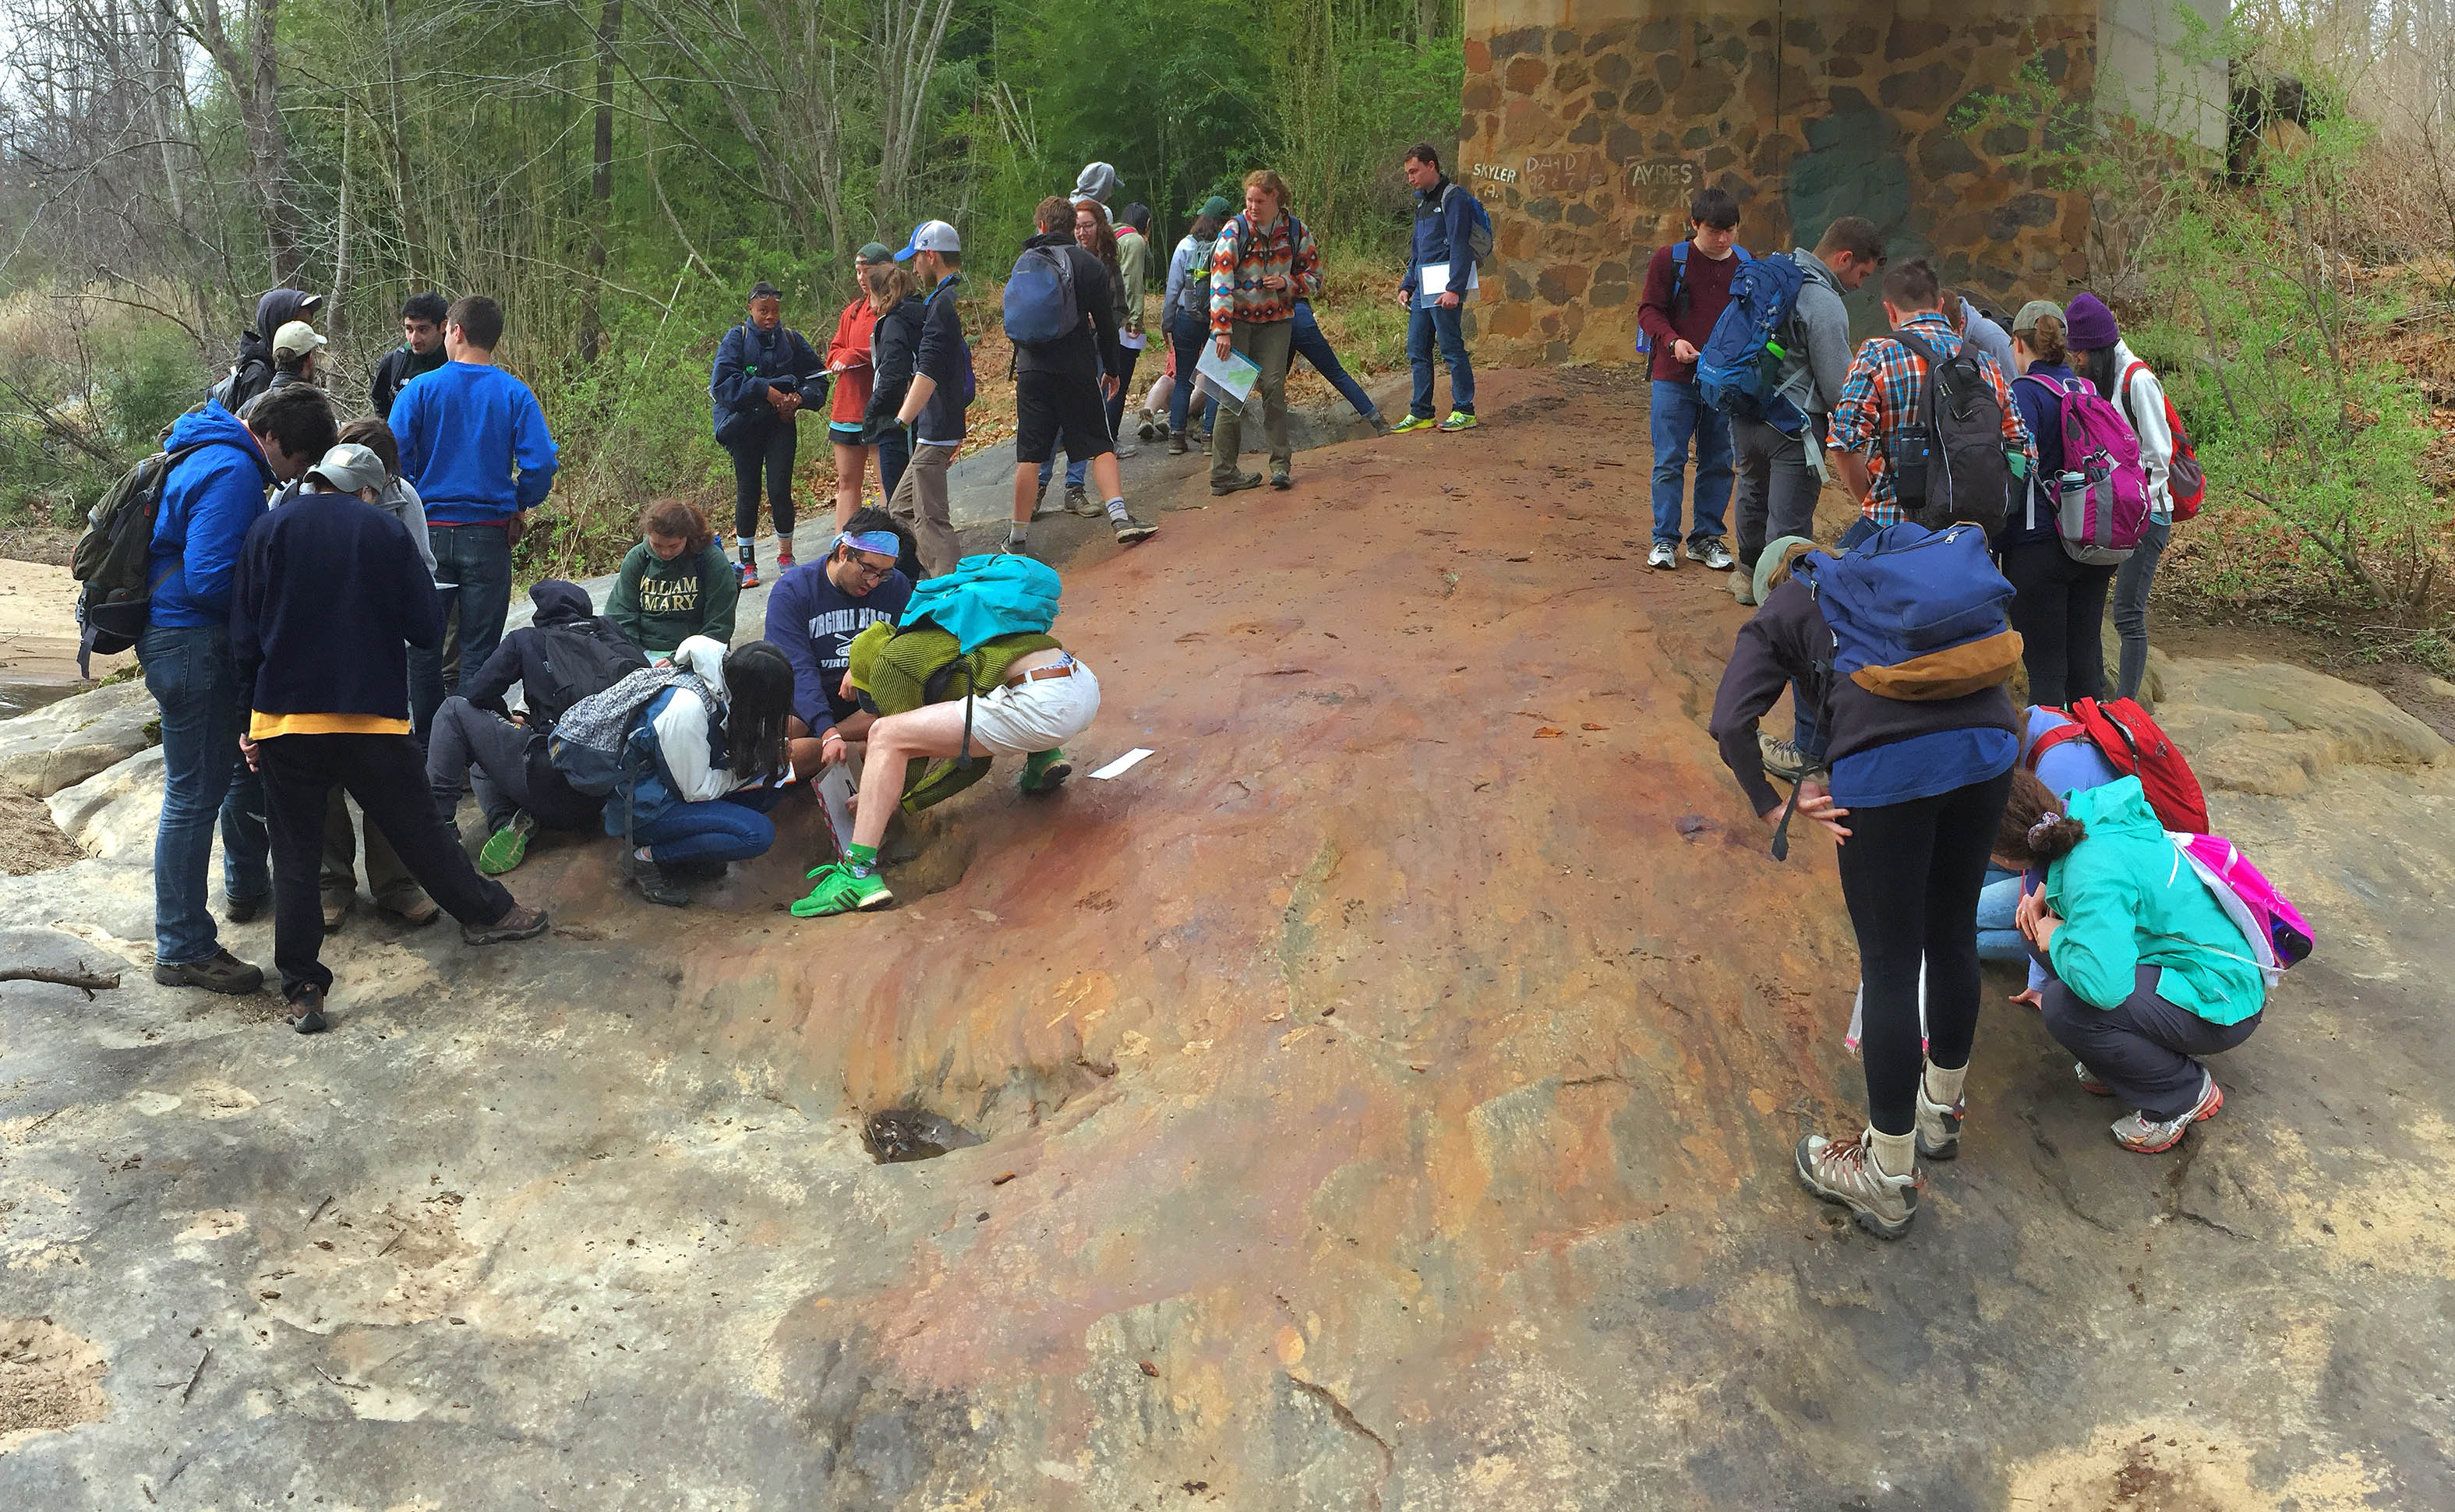
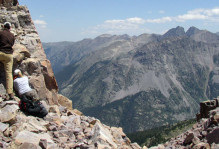
On the morning of our second day we visited a new outcrop – one created when the Ragged Mountain Reservoir, just west of Charlottesville, was enlarged in 2014 and a hillside was blasted out to create an emergency spillway.
This outcrop had yet to have the loving eyes of geologists cast upon it, and seemed a great spot for budding W&M geologists to practice their field observation skills.
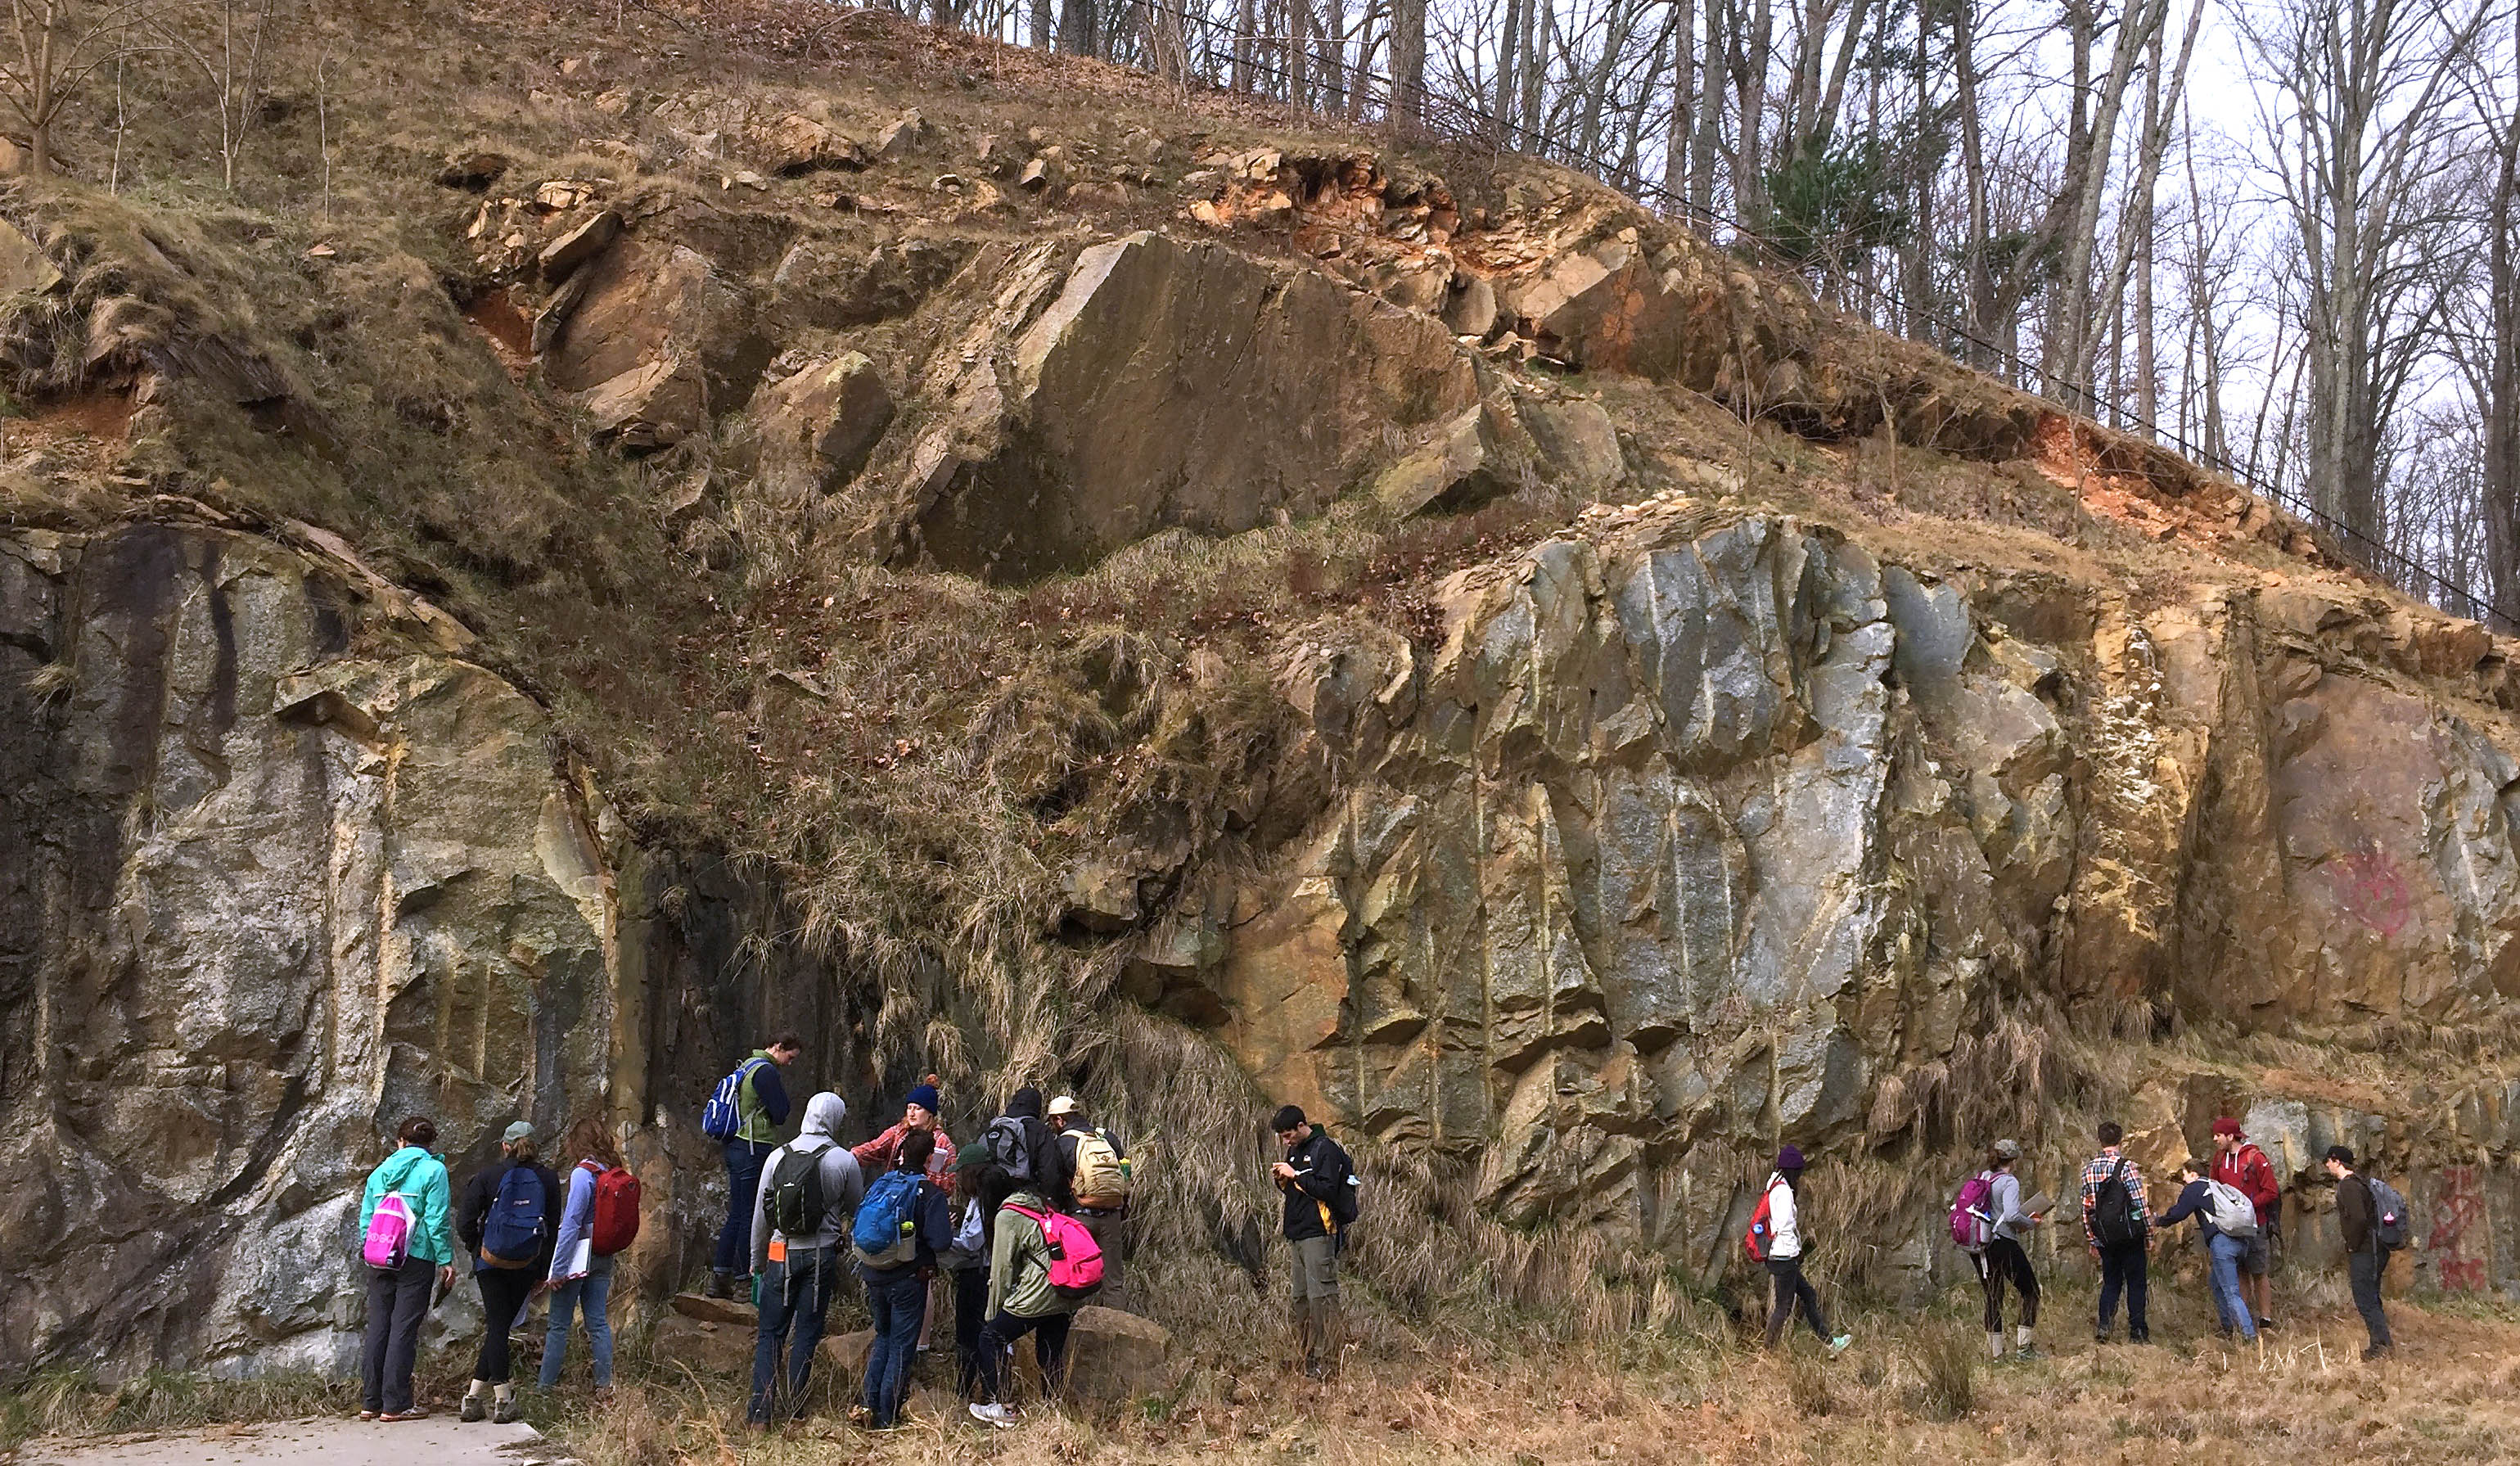
William & Mary geologists examining the Blue Ridge basement complex exposed at the Ragged Mountain Reservoir emergency spillway just west of Charlottesville, Virginia.
The rocks exposed in this large cut are part of the Blue Ridge basement complex, a sequence of metamorphosed igneous rocks that are among the oldest rocks exposed in the Appalachians. At the outcrop my students set to work describing the rocks and measuring the geologic structures.
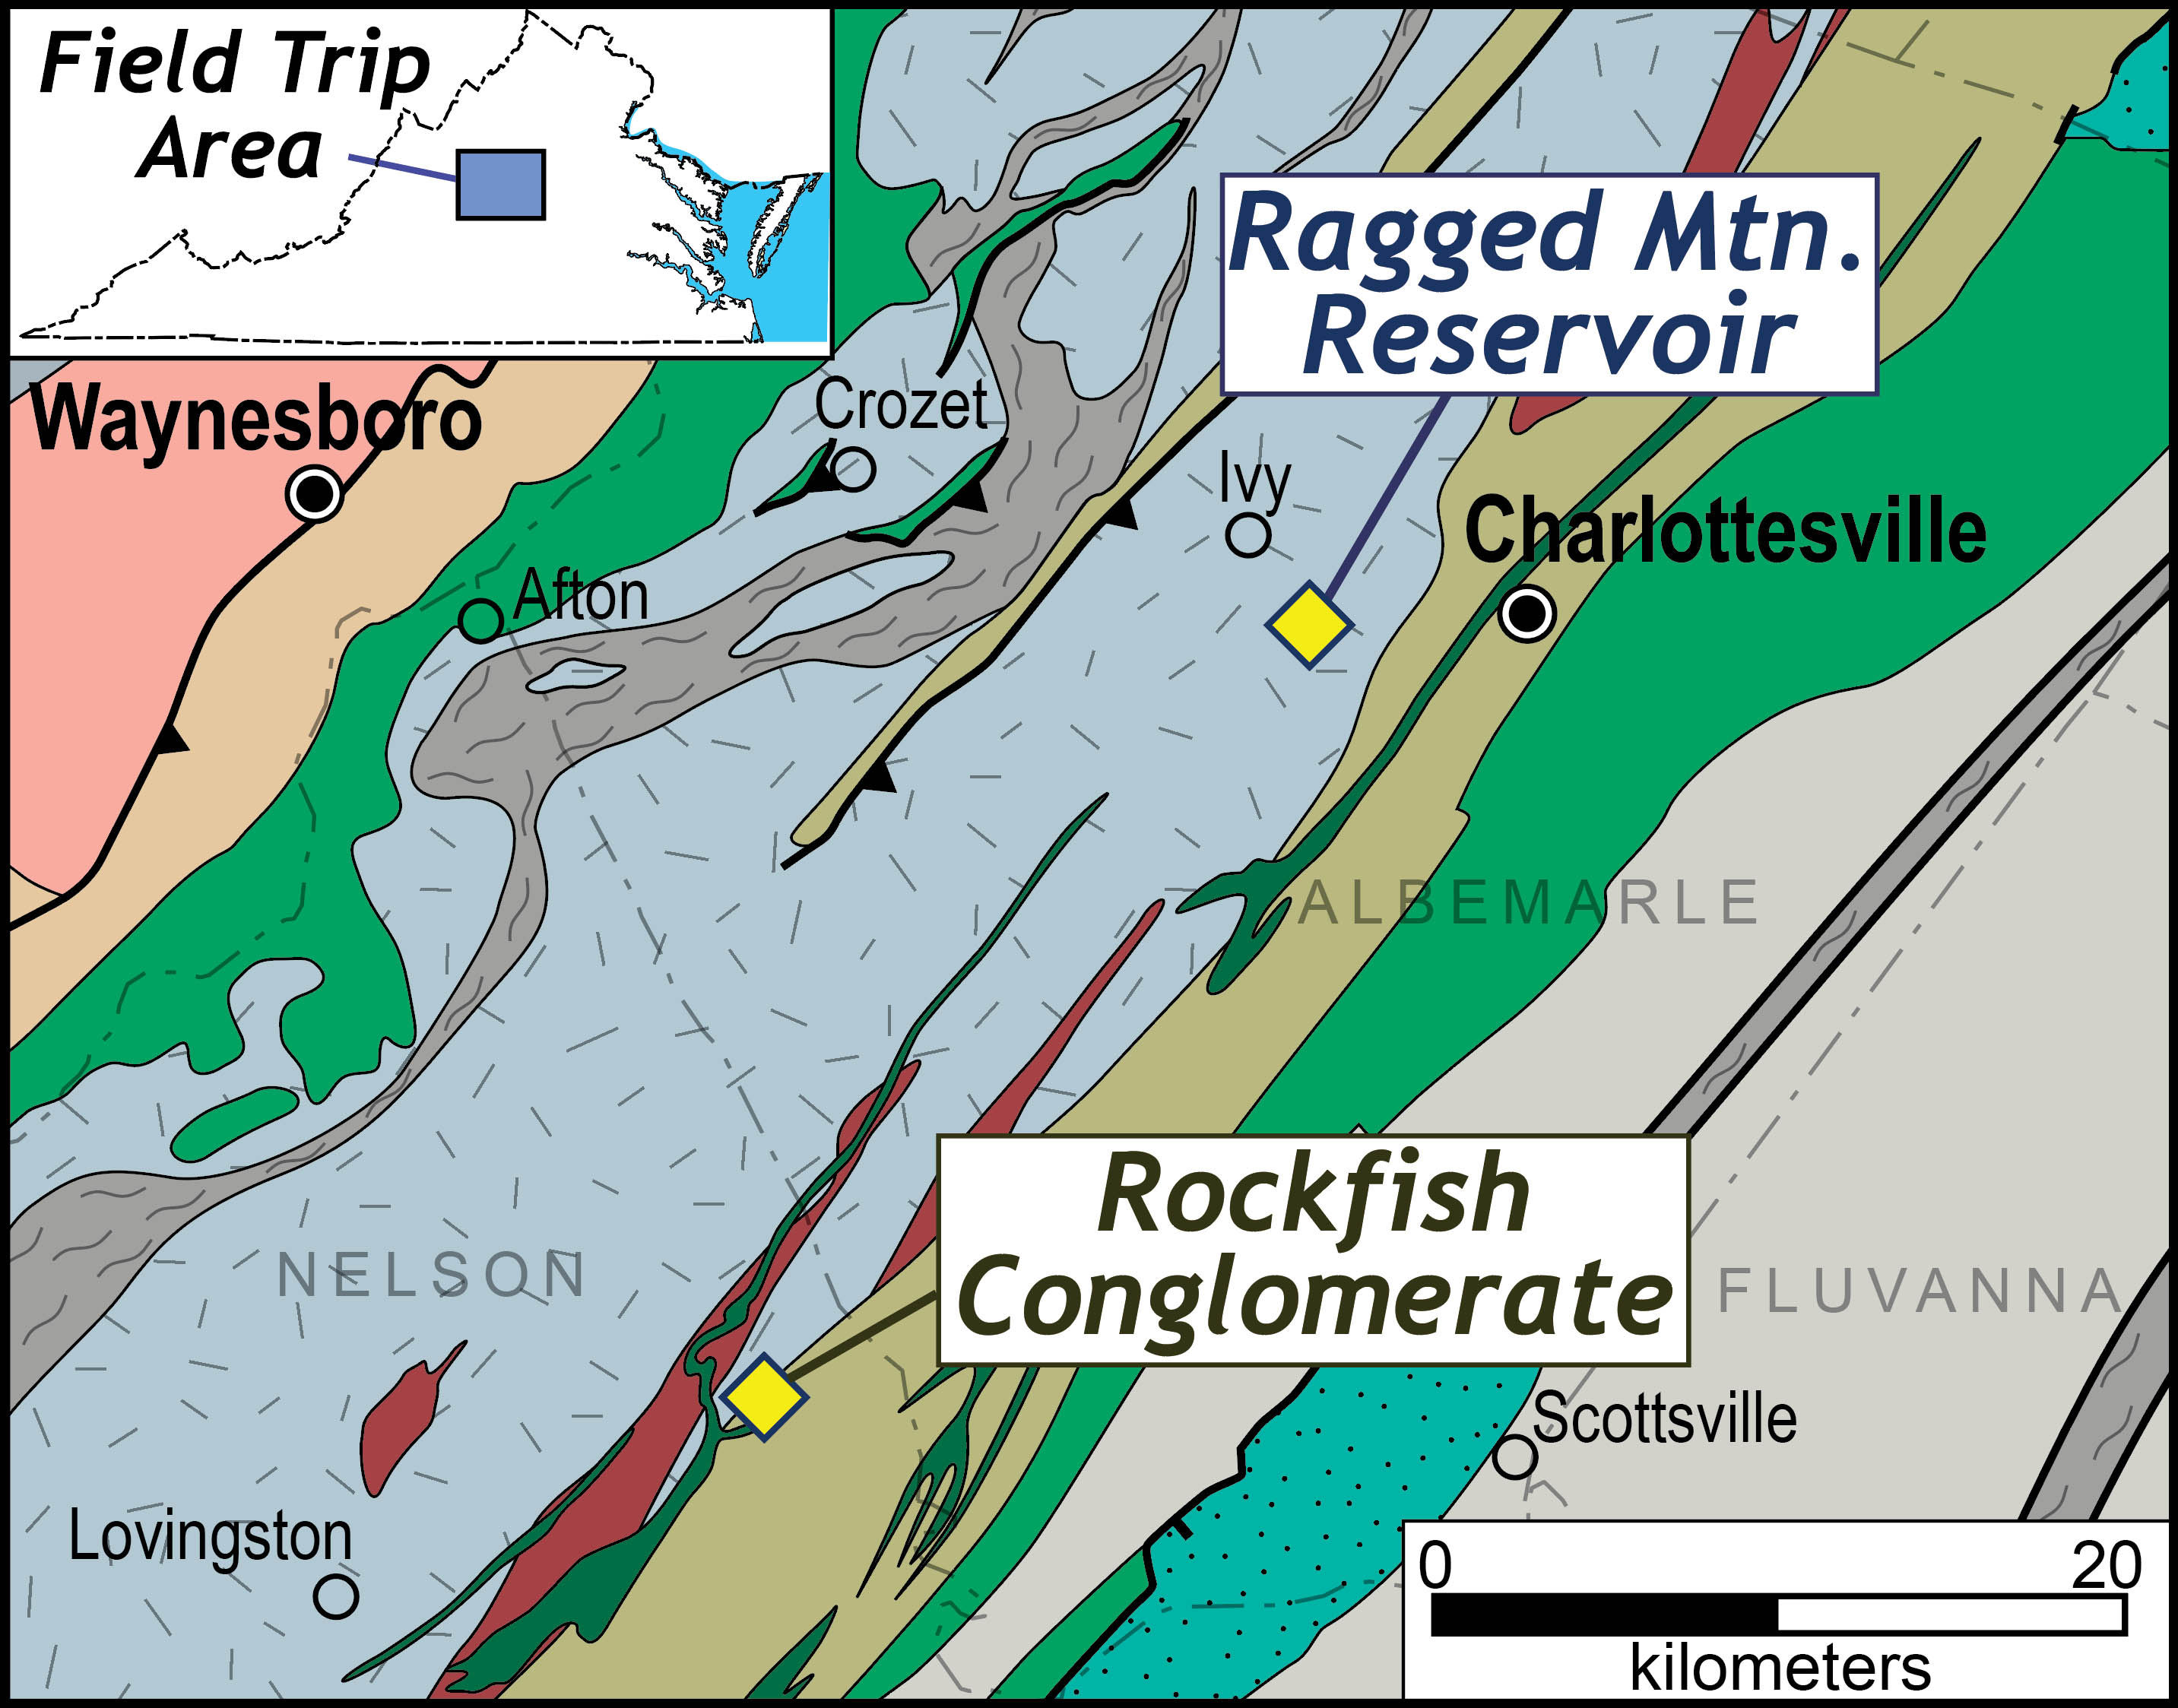
Generalized geologic map of central Virginia. The Blue Ridge basement complex is the light blue stippled unit.
Close-up view of the outcrop at the Ragged Mountain Reservoir. Click on the image for a bigger view.
What they saw were coarse-grained granitoid gneisses with abundant biotite and anastomosing sets of narrow shear zones, evidence that these rocks experienced deformation and metamorphism sometime after they crystallized as igneous rocks. It is a noble outcrop, and will likely become a regular stop on future William & Mary field trips.
Upon returning to William & Mary we discussed many of the outcrops that we visited throughout the weekend and attempted to place them into a broader context and frame up a tectonic history of the mid-Atlantic region. One way in which to visualize this history is to employ the time-depth diagram. It’s one of my favorite diagrams and, eventually, my students learn to appreciate these diagrams which illustrate the ‘path’ through time/depth that rocks take from their formation to the present.
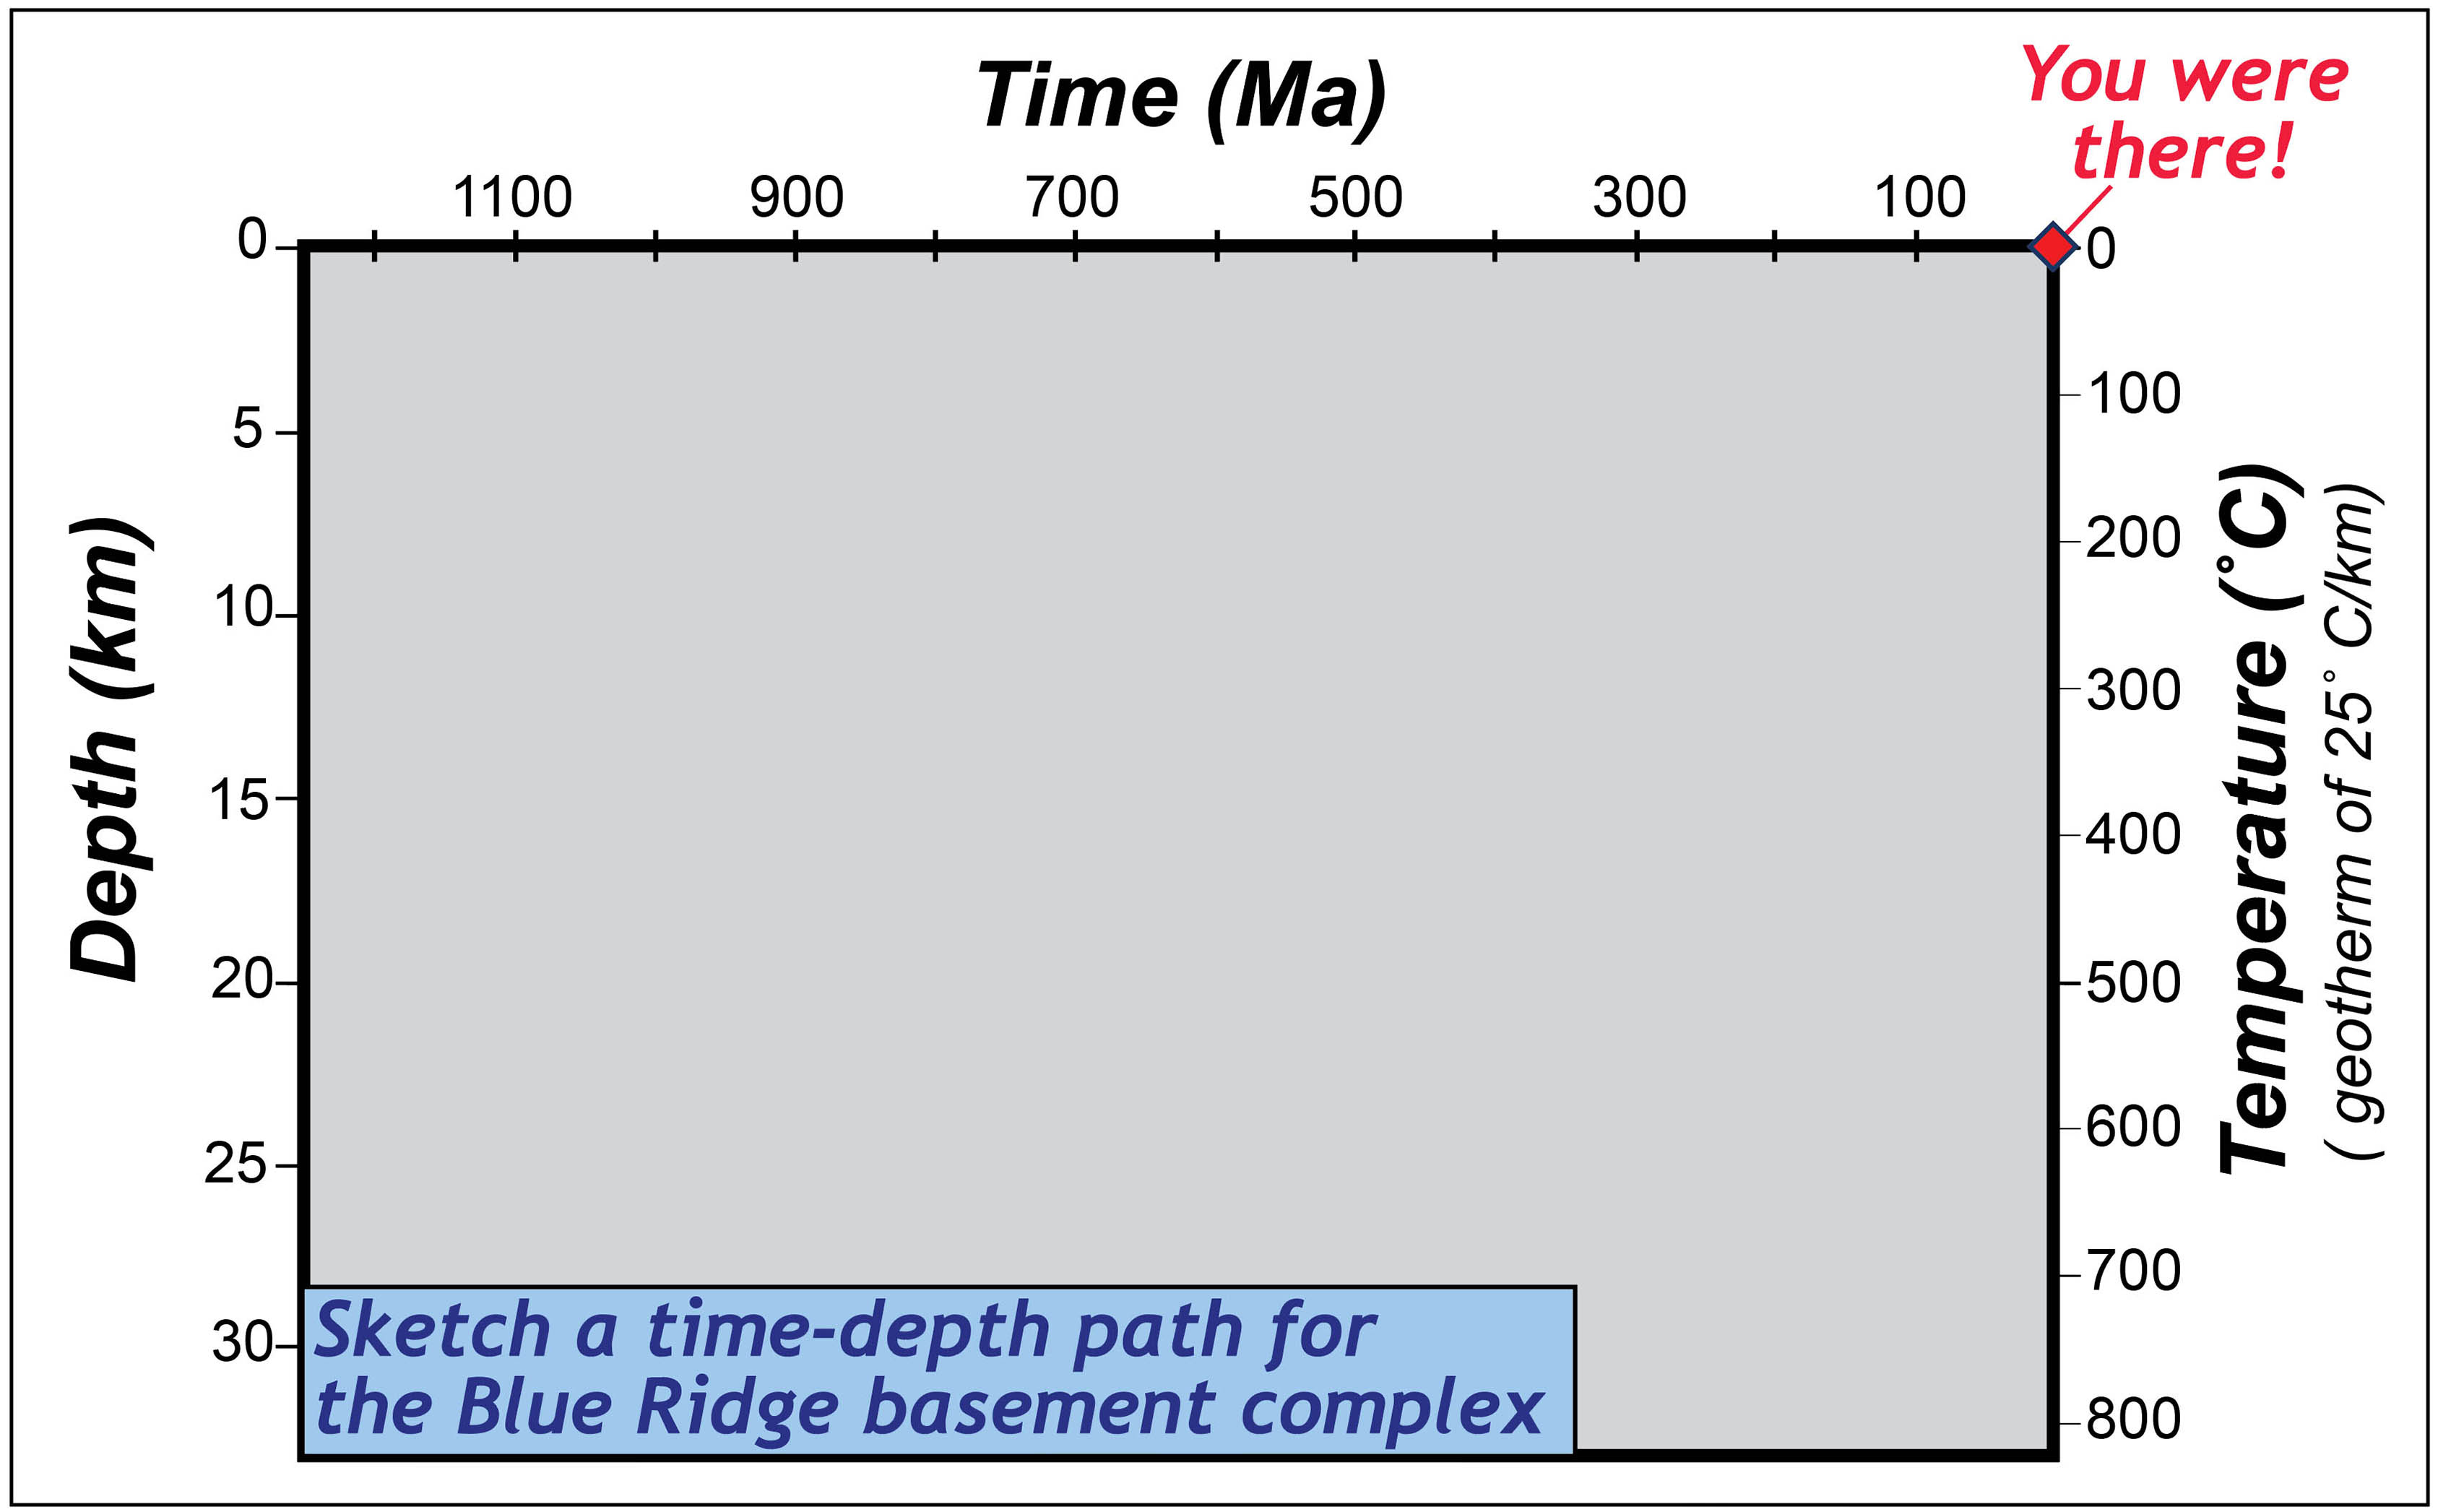
The Time-Depth diagram.
The X-axis plots time – for old rocks it can go back hundreds of millions of years. The Y-axis plots the depth in the crust at which a rock occurs, and I’ve linked this scale directly to the temperature that a rock experiences. Temperature increases with depth into the Earth, and for this graph I picked an average geothermal gradient of 25˚ C km-1 and directly linked the depth to the temperature (the linkage of depth to temperature is a simplifying assumption of this diagram1).
In class, I asked the Earth Structure & Dynamics students to complete the time-depth diagram for the granitoid gneiss that we’d examined at the Ragged Mountain Reservoir. I even provided one point on the curve – that point illustrates that at present these rocks are at the Earth’s surface and available for us to observe. Working out a time-depth plot for a rock requires knowing many things, most of which cannot be known from field observations, but come from geochronology and geothermobarometry research after the field work is done.
When did this rock first form? It originally crystallized from magma, and as the magma froze (turned to rock) different minerals formed – including loads of feldspar and quartz and accessory minerals such as rutile, apatite, and zircon. Zircon is a zirconium silicate, but it typically incorporates a bit of uranium into its crystal structure. Uranium isotopes are radioactive and over time decay to stable lead isotopes. By measuring the ratio of lead and uranium isotopes in the zircon grains, we can determine the crystallization age for many igneous rocks.
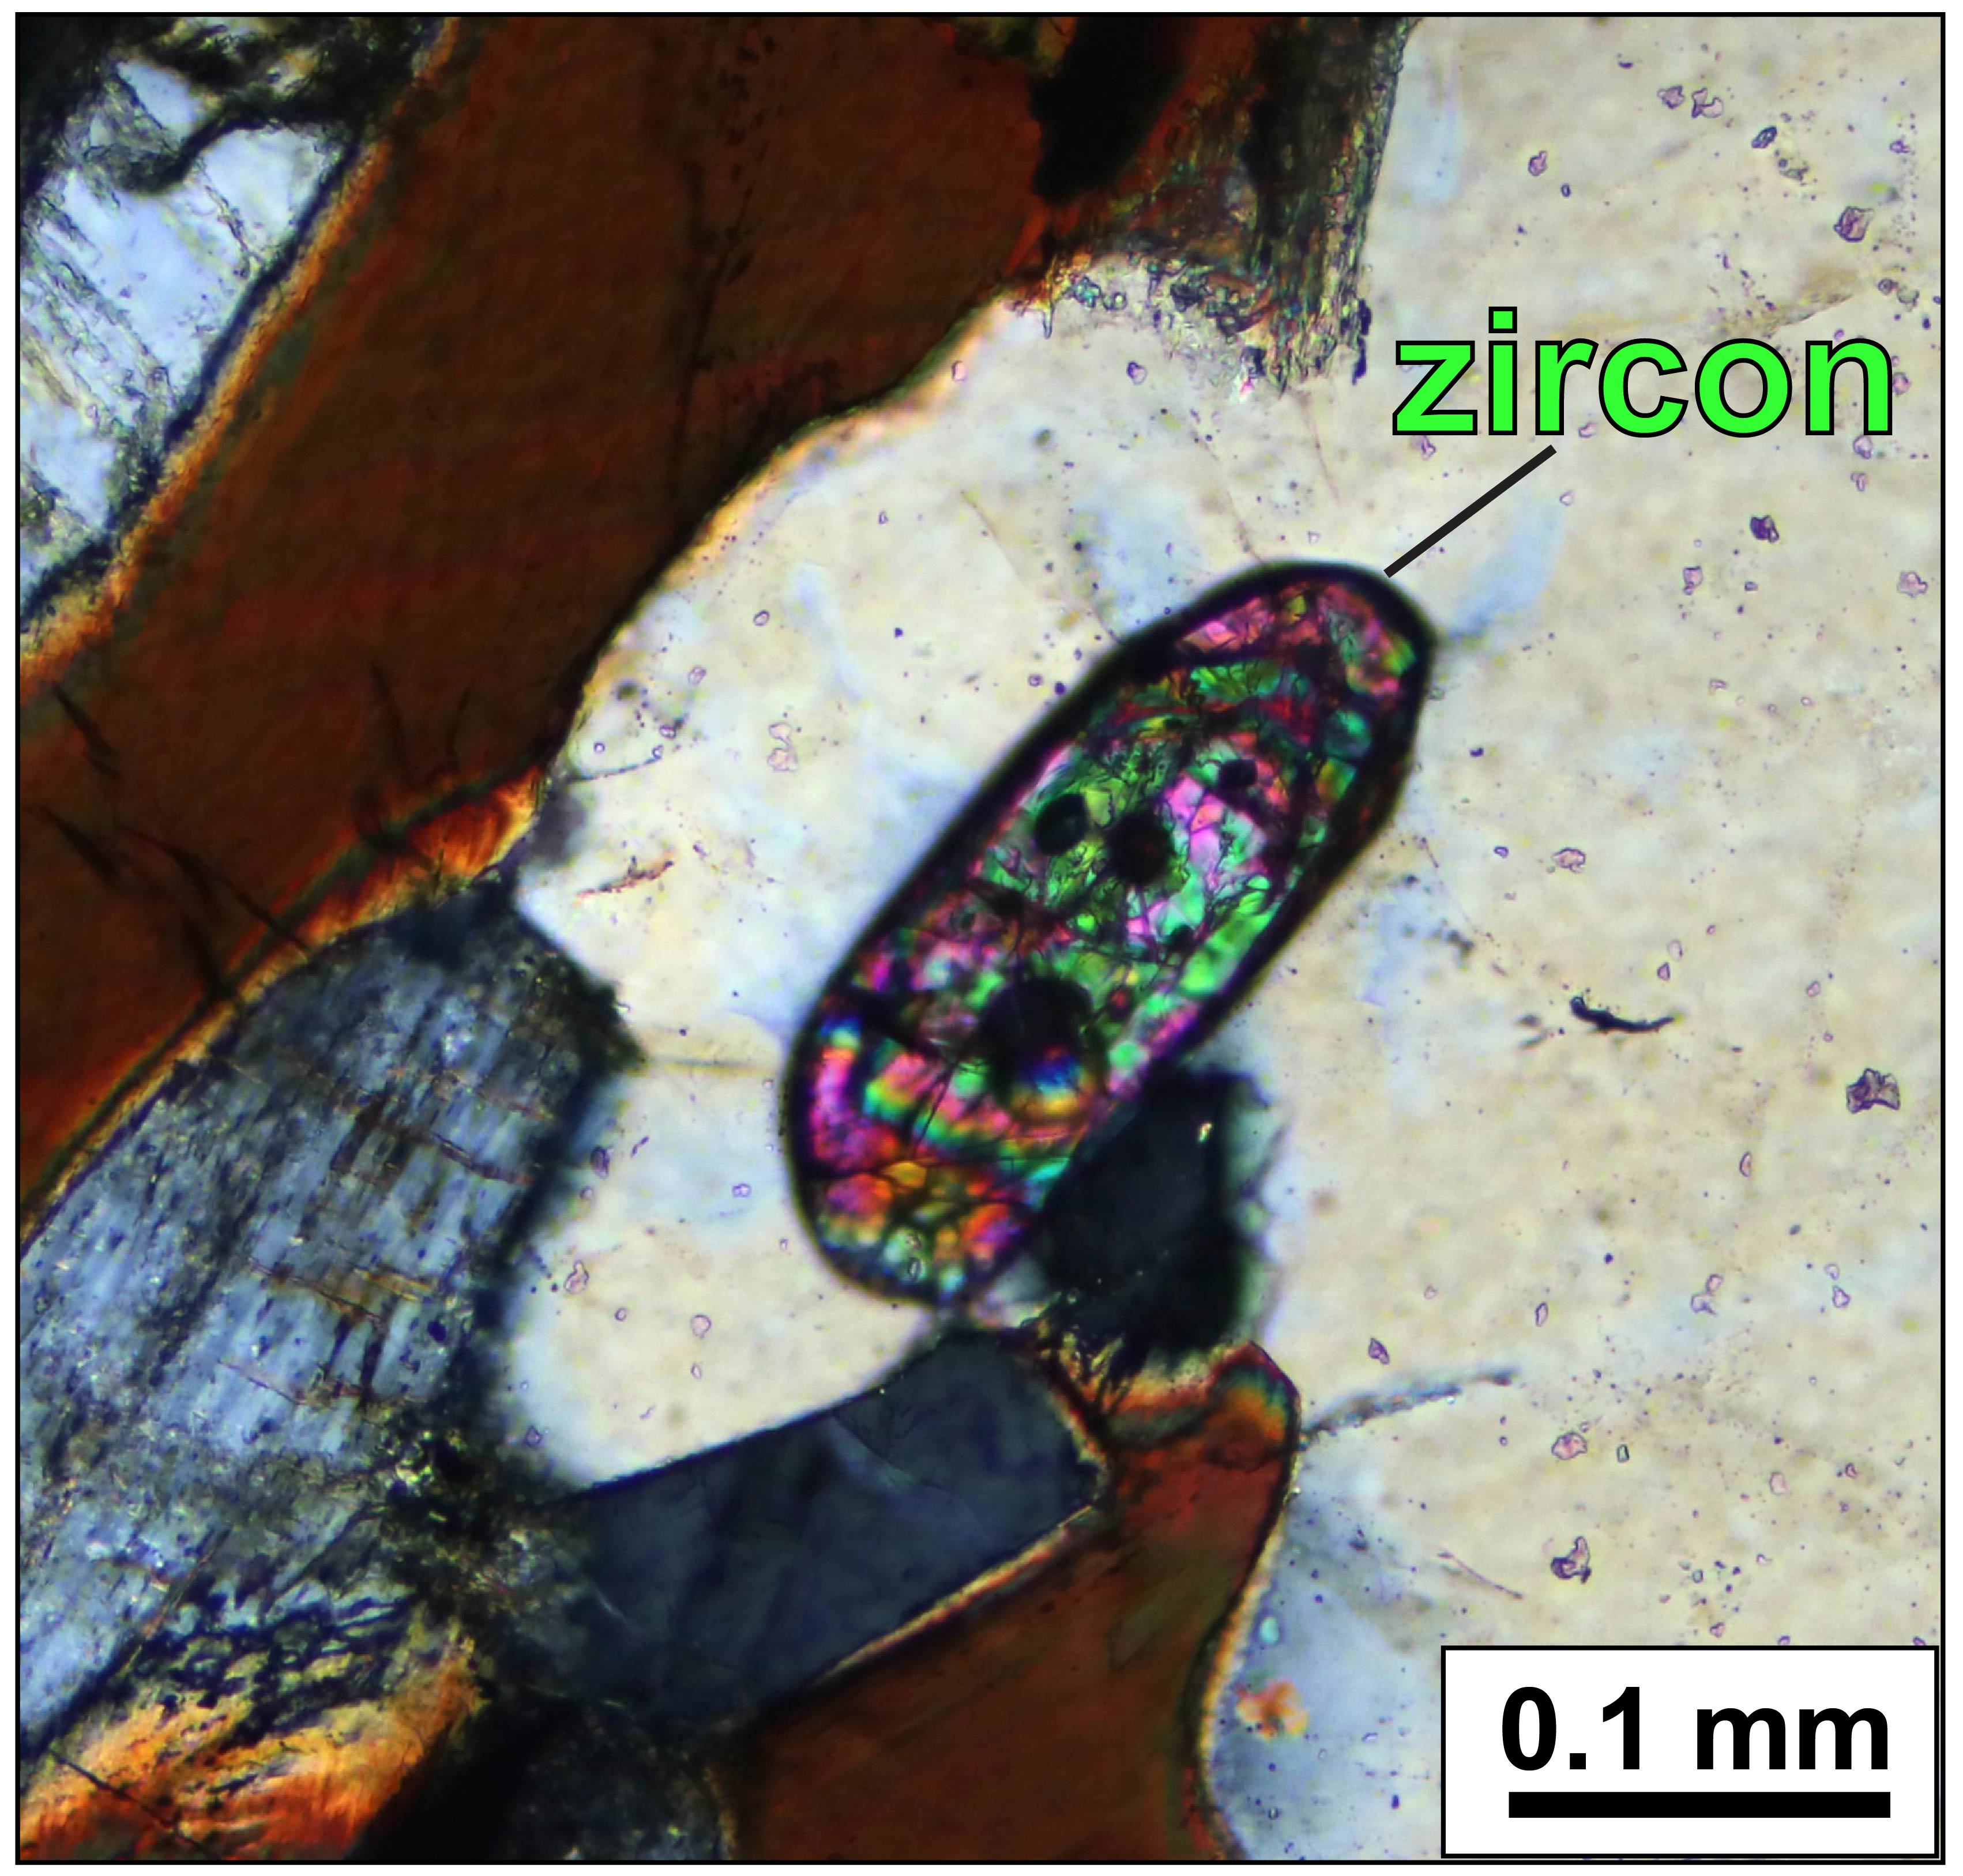
Close-up view of a zircon crystal in a Blue Ridge basement rock. Other visible minerals include quartz, feldspar, and biotite. Cross-polarized light.
My colleagues John Aleinikoff and Scott Southworth at the U.S. Geological Survey have dated many of the Blue Ridge basement rocks, and the biotite-bearing granitoid yields U-Pb zircon ages of 1,030 ± 10 Ma. The rocks exposed at the Ragged Mountain Reservoir crystallized over one billion years ago. These are intrusive rocks and crystallized at considerable depth in the crust – it’s difficult to determine the exact depth of emplacement, but likely at mid-crustal depths of 20 ± 5 km.
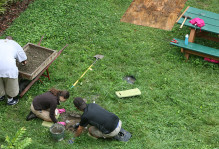
The next piece of the time-depth puzzle came from another outcrop, this one along the Rockfish River ~30 km to the southwest of our first stop. This is the type location for the Rockfish Conglomerate, a distinctive rock that helps paint the tectonic picture of the Appalachians.
W&M geologists busy examining the Rockfish Conglomerate. The outcrop, along the south bank of the Rockfish River, is beneath a rusting highway bridge- note the patina of orange-brown Fe-oxide coating the surface. What an ideal spot for power-washing and outcrop beautification!
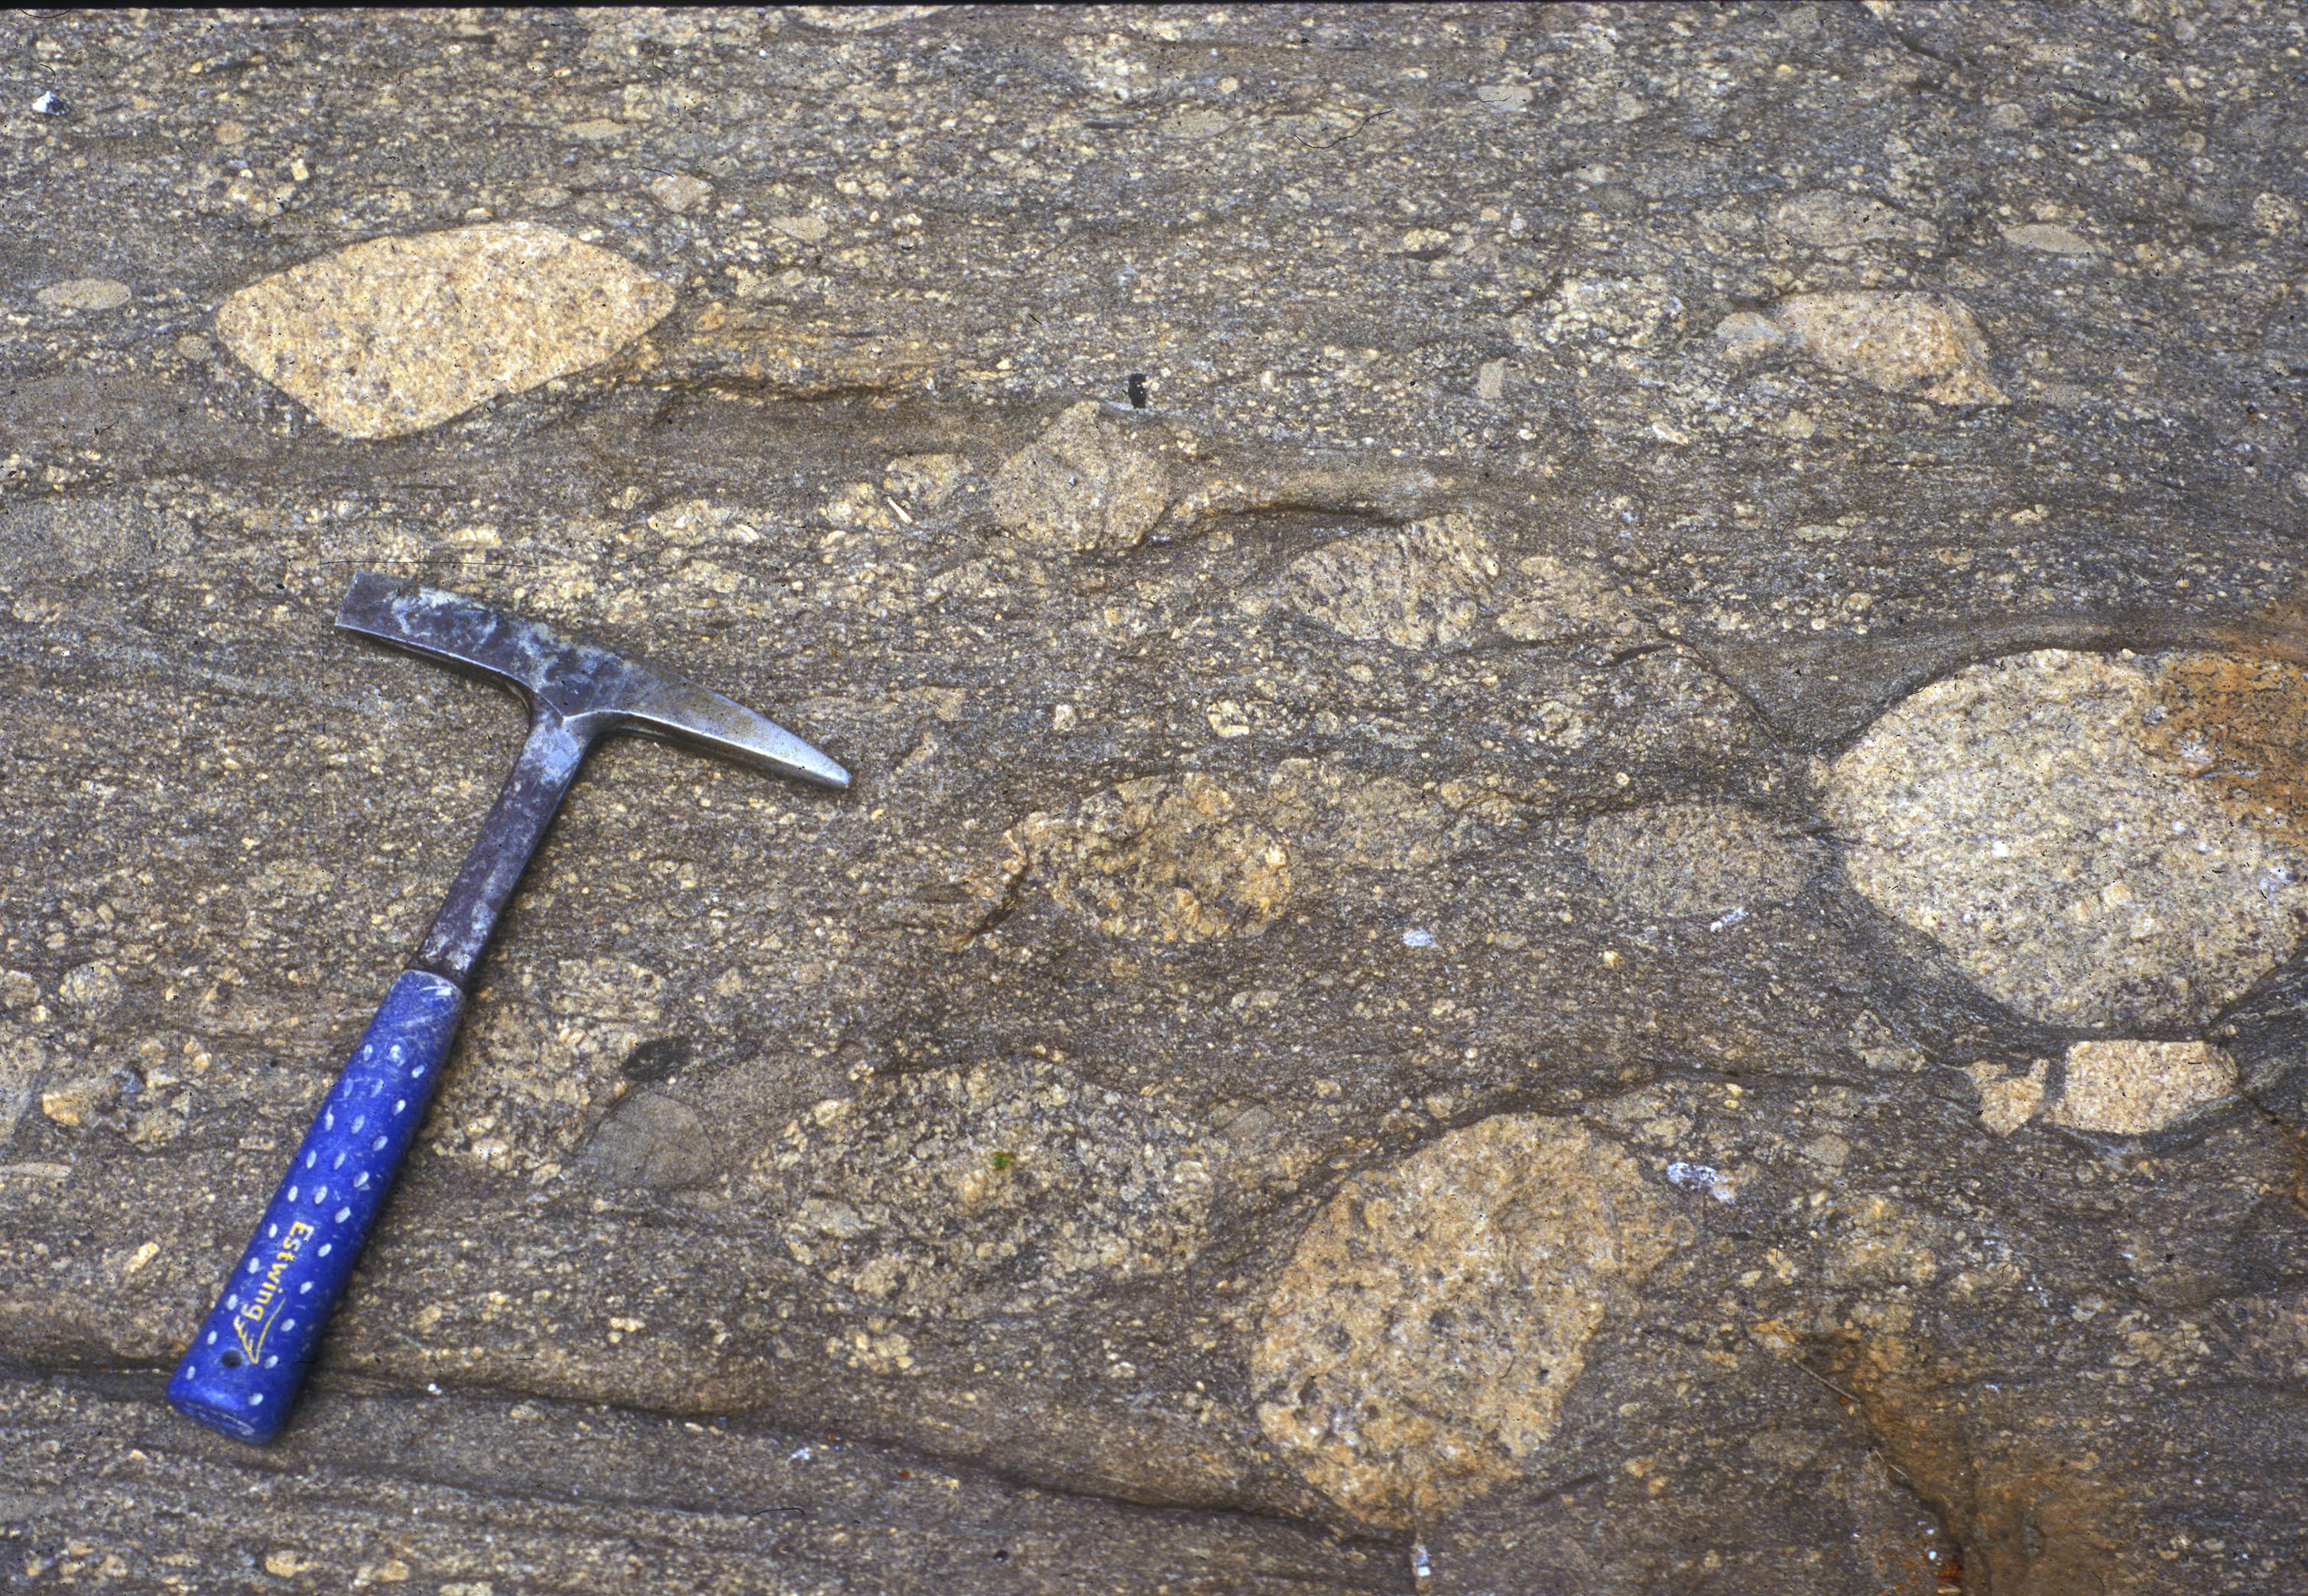
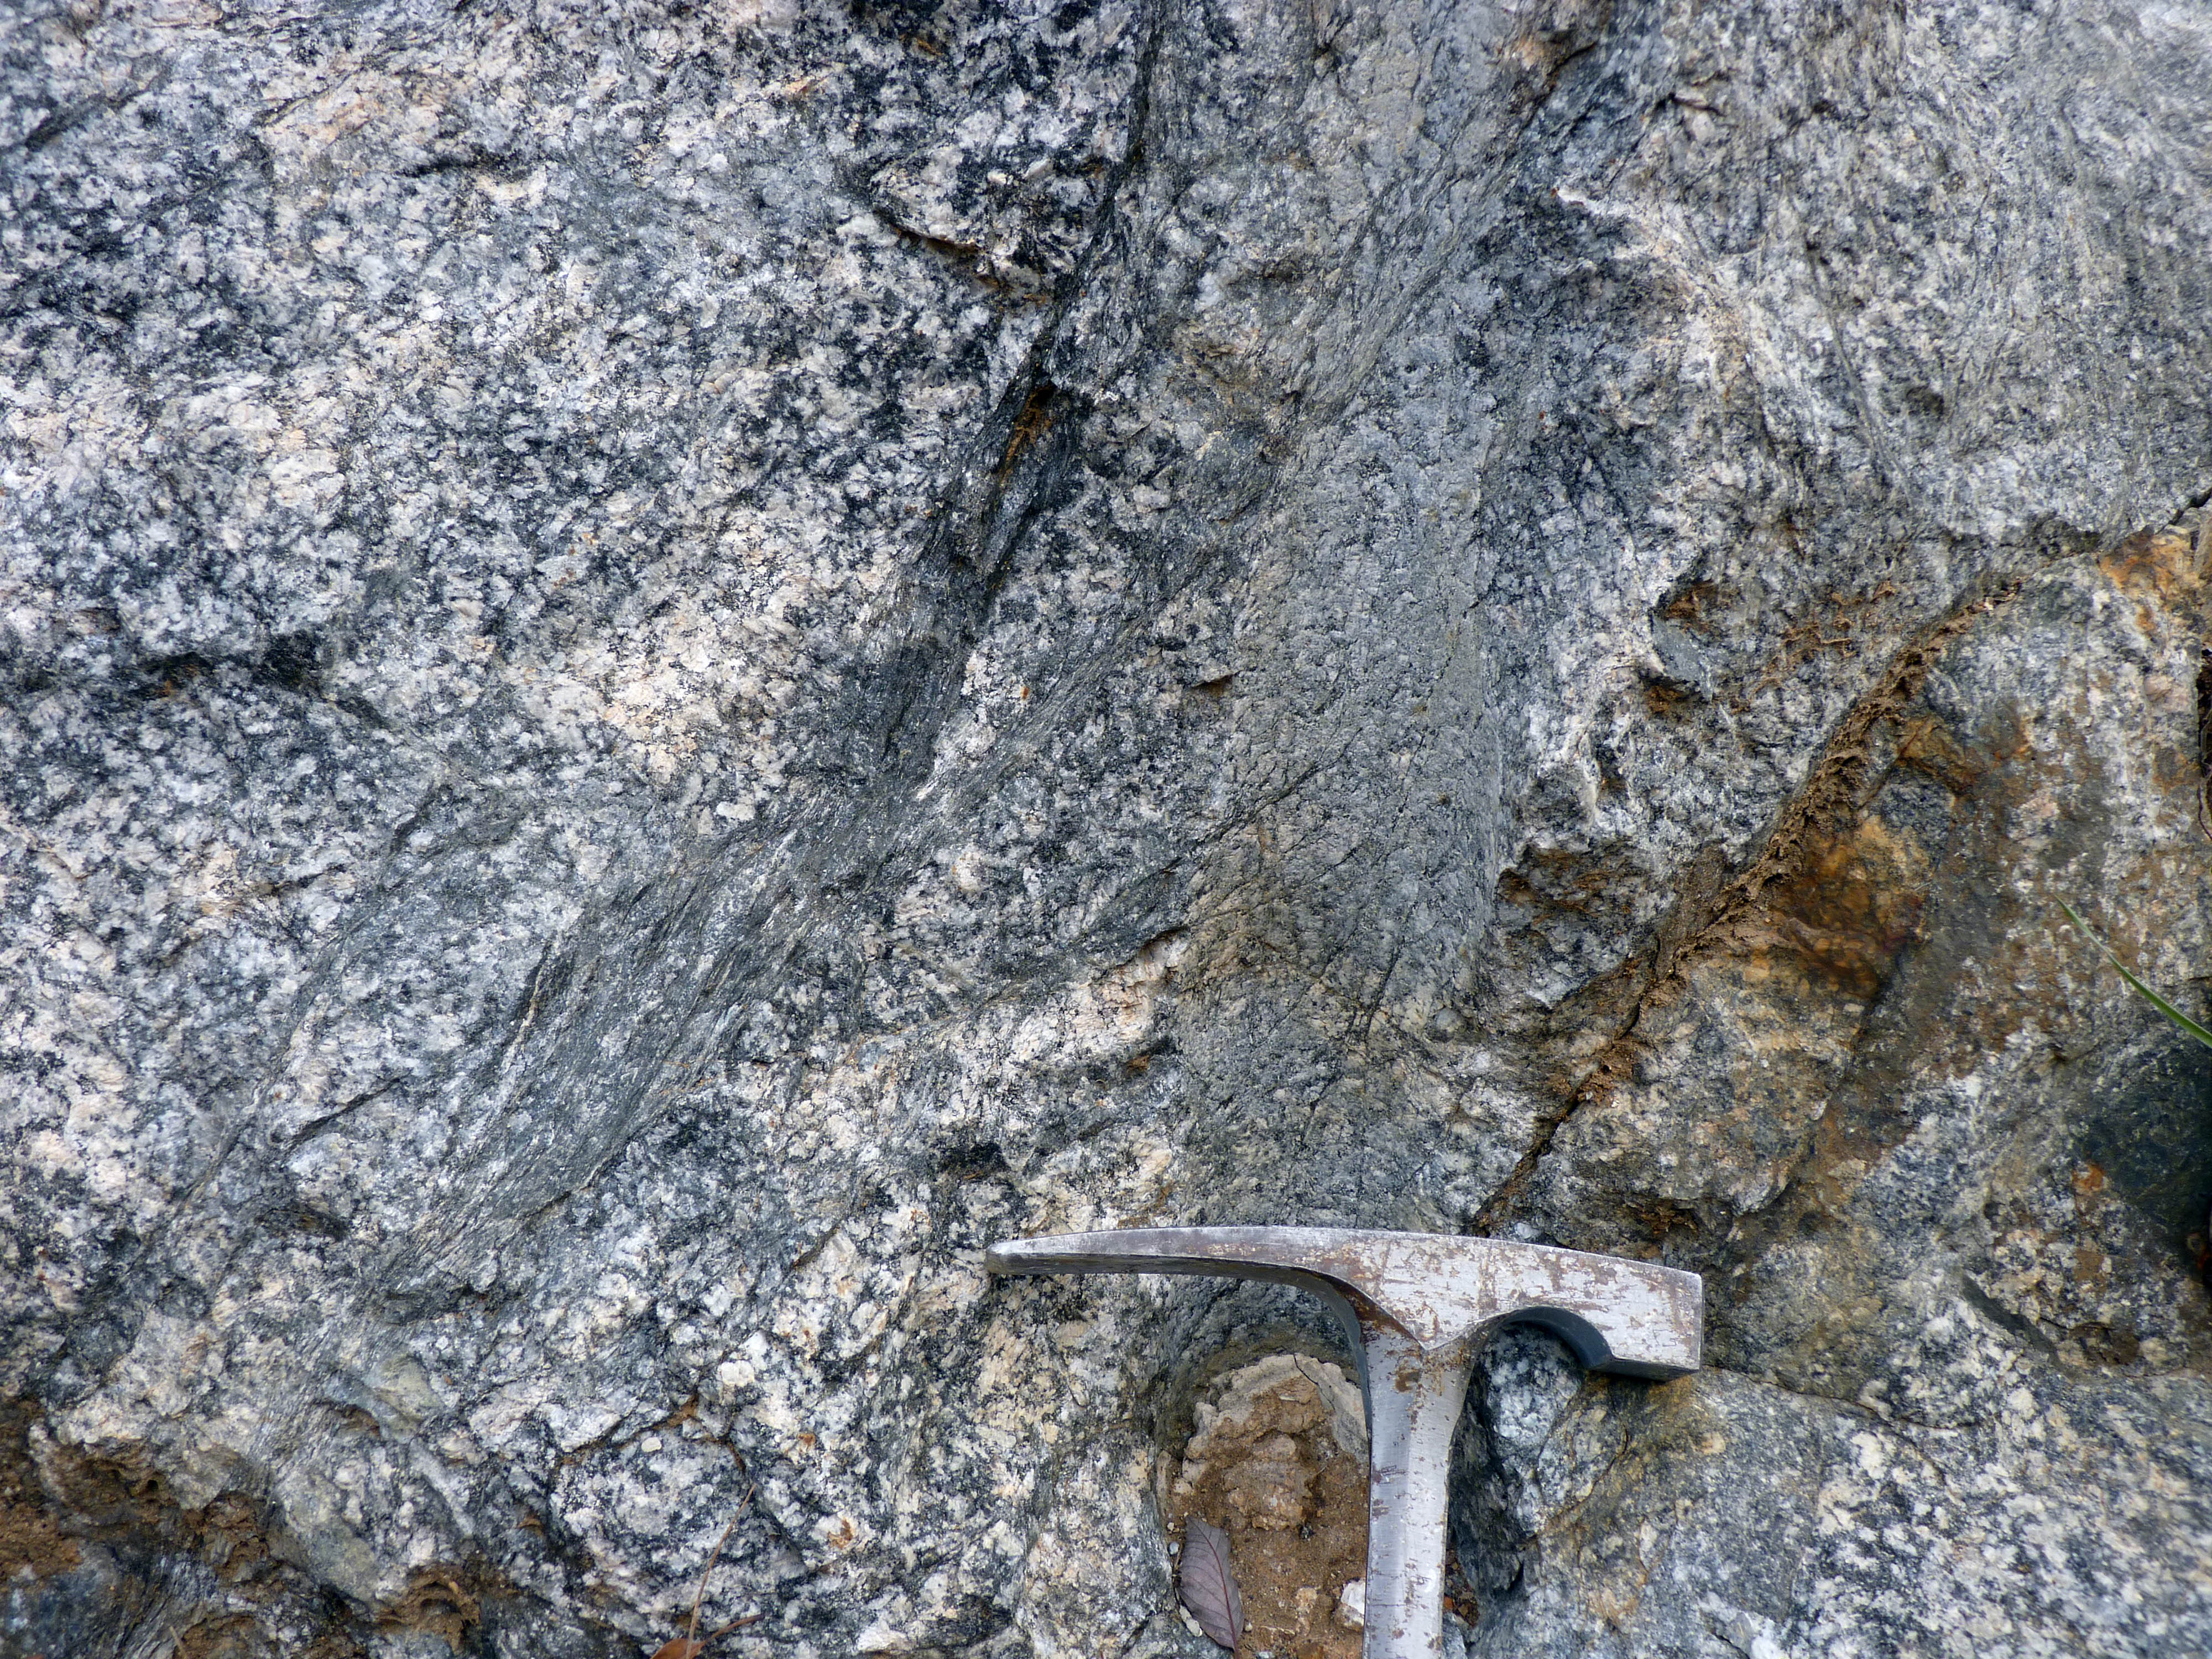
Clasts of basement granitoid in the Rockfish Conglomerate. Click on the picture for a bigger view.
The Rockfish Conglomerate is full of clasts that range in size from coarse-grained sand to cobbles and even a few small boulders. The vast majority of these clasts are pieces of the aforementioned granitic basement rocks. Geologically it follows that when the Rockfish Conglomerate was being deposited, the Blue Ridge basement rocks must have been exposed at the Earth’s surface to provide the source material for the clasts. The Rockfish Conglomerate is the oldest layer in a sequence of cover rocks (they are referred to as cover rocks because they once covered the basement complex), and were deposited during the Neoproterozoic, likely between 720 and 650 Ma.
The Blue Ridge basement complex formed at considerable depth and was later exhumed to the Earth’s surface and there served as the source material for the Neoproterozoic sedimentary cover sequence. This uplift was associated with faulting and rifting of the ancient supercontinent of Rodinia.
Ultimately, Rodinia rifted apart and the waters of the newly formed Iapetus Ocean washed over the region that would become the Virginia Blue Ridge. During the early Paleozoic, the old Blue Ridge rocks were buried beneath kilometers of sandstone, mudstone, and limestone that were deposited along the margin of the Iapetus Ocean.
Just how deeply buried was the Blue Ridge basement complex? A close look at the granitoid gneiss reveals an array of metamorphic minerals such as garnet, biotite, and muscovite. These minerals formed as old igneous minerals reacted with hot fluids and recrystallized (in a solid state) to new minerals.

Micrograph illustrating metamorphic minerals in the Blue Ridge basement complex. Top- plane-polarized light, Bottom- cross-polarized light.
Garnet and biotite both contain cations of iron (Fe) and magnesium (Mg). The Fe-Mg exchange between these two minerals is a function of the temperature at which these minerals formed – by analyzing the mineral chemistry an estimate metamorphic temperature can be ascertained. Our work using the garnet-biotite geothermometer on these rocks yields peak metamorphic temperatures of 475 ± 25 ˚C.
The old Blue Ridge rocks were buried to depths of 15 to 20 km, and sent back to the mid-crustal levels from where they were originally emplaced. Curiously, the total thickness of the Paleozoic sedimentary rocks that blanketed the region is between 8 and 10 km – that’s not enough overburden to metamorphose these rocks to 475 ˚C. During tectonic collision in the later half of the Paleozoic, the crust in the Appalachian region was tectonically thickened as mountains were built, it’s these processes that helped to deeply bury the Blue Ridge rocks.
Muscovite is a potassium-bearing mica that formed during deformation and metamorphism. Some of the potassium in the muscovite is Potassium 40 (40K), a radioactive isotope that decays to Argon 40 (40Ar), and can be used as a geochronometer. In 2004 my research student Katie Wooton, working in collaboration with the U.S. Geological Survey’s Mick Kunk, dated muscovite (and other K-bearing minerals) from rocks in the central Virginia Blue Ridge2. We obtained ages of 330 to 345 Ma, these are interpreted as cooling ages because muscovite does not retain argon in its crystal lattice at temperatures above ~350 ˚C.
These cooling ages tell us that the Blue Ridge basement has been at temperatures <350 ˚C for the past 340 million years or so. We now have an array of points with which to more fully construct a time-depth curve for the Blue Ridge basement rocks. We could employ other geochronometers such as U-Pb in rutile, 40Ar/39Ar in K-feldspar, and apatite fission track to garner even more points, but let’s keep this simple.
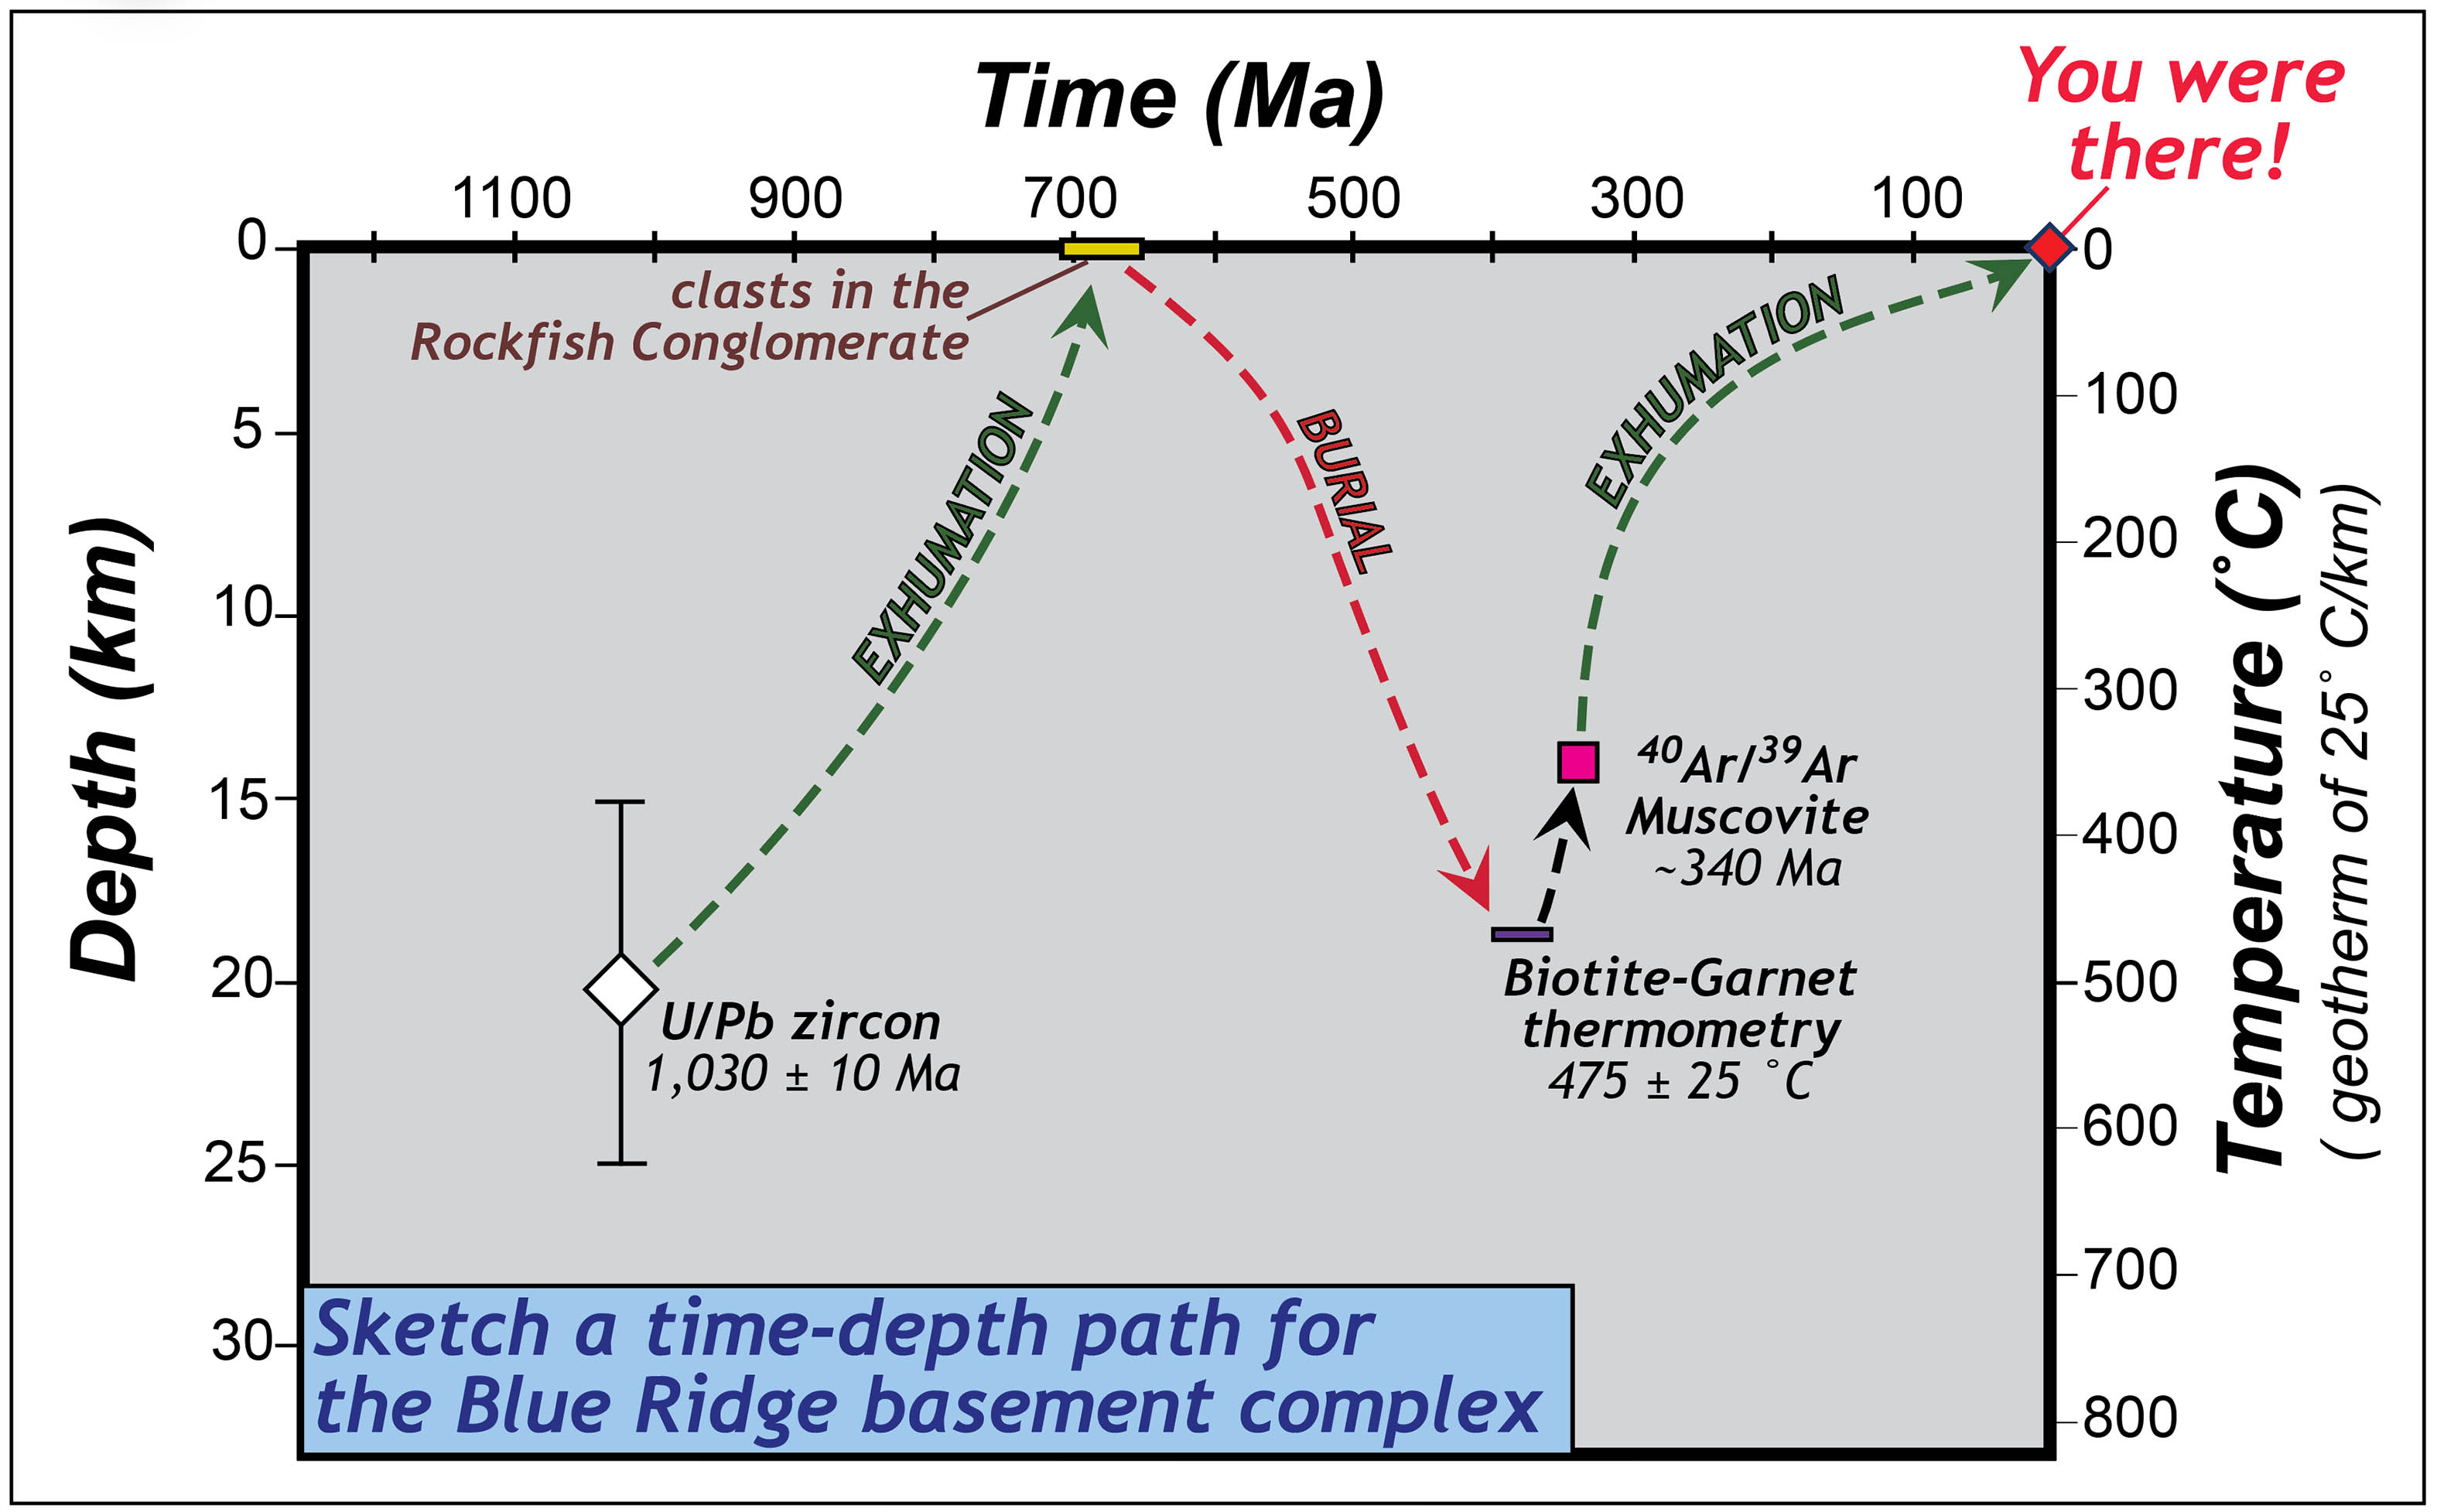
The Time-Depth path for Blue Ridge basement rocks.
In the 1 billion years since they formed, these basement rocks have exhumed twice and buried once (at least once) – that’s quite a geologic history. This tale of magmatism and exhumation followed by burial, metamorphism, deformation and ultimately a 2nd episode of exhumation is quite a story and one that neatly illustrates major earth processes at work over geologic time.
The 2017 Earth Structure & Dynamics field trip was awesome (it even involved karaoke); I hope the lessons we learn in the field and our further explorations of time-depth space have some staying power with the GeoWallies.

The 2017 Earth Structure & Dynamics class in the Blue Ridge Mountains, Virginia.
Notes
1 The Earth’s geothermal gradient typically averages between 20 and 35 ˚C per kilometer. A technique known as geobarometry, based on mineral compositions, can provide a better estimate of the pressure that a rock experience and be used to estimate the depth.
2 The actual technique Katie employed was the 40Ar/39Ar method, a modern and more reliable variant of the 40K/40Ar method.
References
Bailey, C.M., Southworth, S., and Tollo R. P. 2006, Tectonic history of the Blue Ridge north-central Virginia, in Pazzaglia, F.J., ed., Excursions in Geology and History: Field Trips in the Middle Atlantic States: Geological Society of America Field Guide 8, p. 113-134, doi:10.1130/2006.fld008(07).
Southworth, S., Aleinikoff, J.N., Tollo, R.P., Bailey, C.M., Burton, W.C., Hackley, P.C., and Fanning, M.C. 2010. Mesoproterozoic magmatism and deformation in the norther Blue Ridge, Virginia and Maryland: Application of SHRIMP geochronology and integrated field studies in the definition of Grenvillian tectonic history: From Rodinia to Pangea: The Lithotectonic Record of the Appalachian Region, Geological Society of America Memoir 206, p. 795-836.
Wooton, K.M., Bailey, C.M., and Kunk., M.J., 2005, The nature and timing of deformation in the Blue Ridge Province, Greene County, Virginia, Geological Society of America Abstracts with Programs, v. 37.

Comments are currently closed. Comments are closed on all posts older than one year, and for those in our archive.
Does the apatite fission track dating match the 2nd exhumation curve?