
A Year in the Life of James
This is a piece about two James’: James McCulla (W&M class of 2010) and the James River. James McCulla stands about 6′ 2″, hails from Richmond, and is a geology major and part-time rugby icon. The James River is over 400 miles in length, flows through Richmond, and is an iconic Virginia river. The man and the river became linked in 2009.
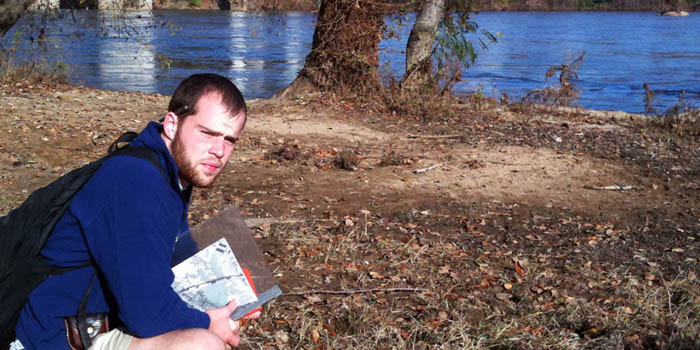
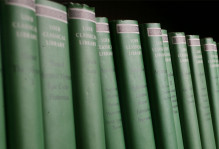
James McCulla (foreground) and James River (background). Belle Island, Richmond.
In January 2009 James McCulla appeared at my office and inquired about possible senior research projects. All geology majors at W&M conduct original research during their senior year, this culminates in a thesis that is very much a capstone experience. James is interested in structural geology and chose to focus his research on understanding the geometry, timing and significance of fracturing and faulting in the granitic bedrock exposed in and along the James River in Richmond. James is picking up where students in the advanced structural geology seminar left off at the end of 2008 by adding more study sites and quantitative analysis. Last spring James McCulla did background research and crafted a thesis proposal in the Introduction to Research class (a 1-credit course that juniors take).
All the while, the James River kept flowing through Richmond delivering water from across the Appalachian Mountains and Piedmont to Virginia’s Coastal Plain and on towards the mouth of the Chesapeake Bay. On average, as it flows through Richmond, the James River discharges approximately 5,000 cubic feet of water every second (abbreviated cfs). A cubic foot of water contains 7.5 gallons, thus the James River carries over 37,000 gallons per second, that is a lot of water, but the quantity is hard to put into perspective. Imagine the James River pouring into William & Mary Hall, at its average discharge rate the river would take about 15 minutes to fill the Hall to the rafters. To see how much water is flowing down the James River in Richmond check out the U.S. Geological Survey’s Water Resources website.
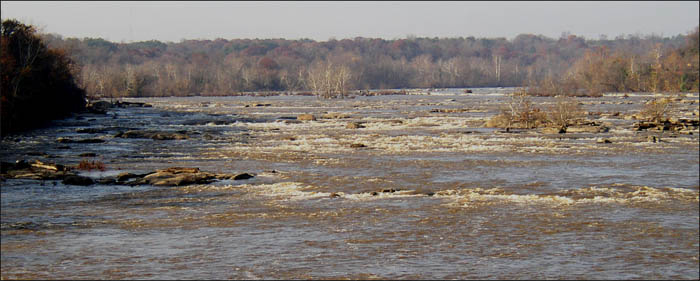
Upstream view of the James River in Richmond flowing under moderately high water conditions (~13,500 cfs, ~7′ on the Richmond-Westham gage).
River discharge is not static. Over the course of a year the James River’s discharge is widely variably, from low flow conditions with <1,000 cfs to flood stages in excess of 50,000 cfs. The height of the river varies with discharge, at flood stage the river may run 10 ft (3 m) higher than at low flow. There is an annual rhythm to the James River’s discharge; typically it flows at low water levels from the late summer into the fall and at its highest levels in the late winter to spring. For the most part 2009 was a typical year for the James River; there were a number of relatively high stages during the spring and river levels fell throughout the summer into the early fall. The last months of the year brought abundant precipitation, from nor’easters and a monster snowfall in western Virginia, causing the James River to top out above flood stage three times in a six-week period. For the record, the lowest flow (950 cfs) occurred on September 17th and the highest flow (52,000 cfs) on December 10th.
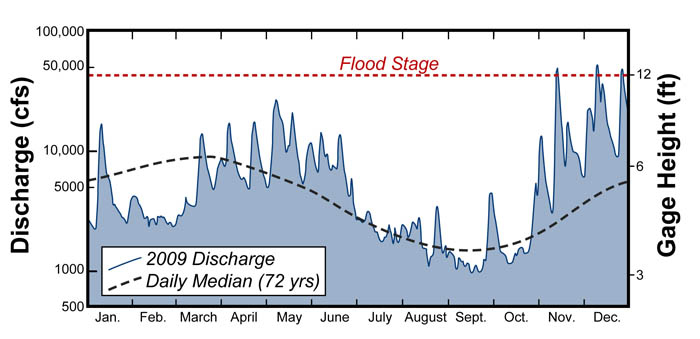
James River discharge (in cfs) and gage height (in feet) at the Richmond-Westham gaging station for 2009 compared with median flow conditions (72 years of record). Note the logarithmic scale for discharge.
For James McCulla to conduct his research he needs to be able to see and touch the bedrock exposed in the James River’s channel, this is best done at low water levels (below 4′ on the Richmond-Westham gaging station). Our fieldwork plans were spoiled throughout late May and June as the river ran too high. James McCulla spent late June through early August in Italy taking summer courses; all the while the James River kept flowing, but at progressively lower water levels. Fieldwork commenced in September and October as acres of rock were exposed at low water. James McCulla’s research indicates that the granitic bedrock was affected by two episodes of fracturing that occurred at different times and under distinctly different physical conditions and stress states, he’ll be presenting these results at the Geological Society of America meeting in Baltimore later in this year.
As 2009 came to a close the James River, rollicking at high water, carried truckloads of sediment-laden water down its channel and in the process drown the underlying bedrock. All the while, James McCulla dreams of receding waters in 2010.
No comments.
Comments are currently closed. Comments are closed on all posts older than one year, and for those in our archive.