
A 10-year Time Series
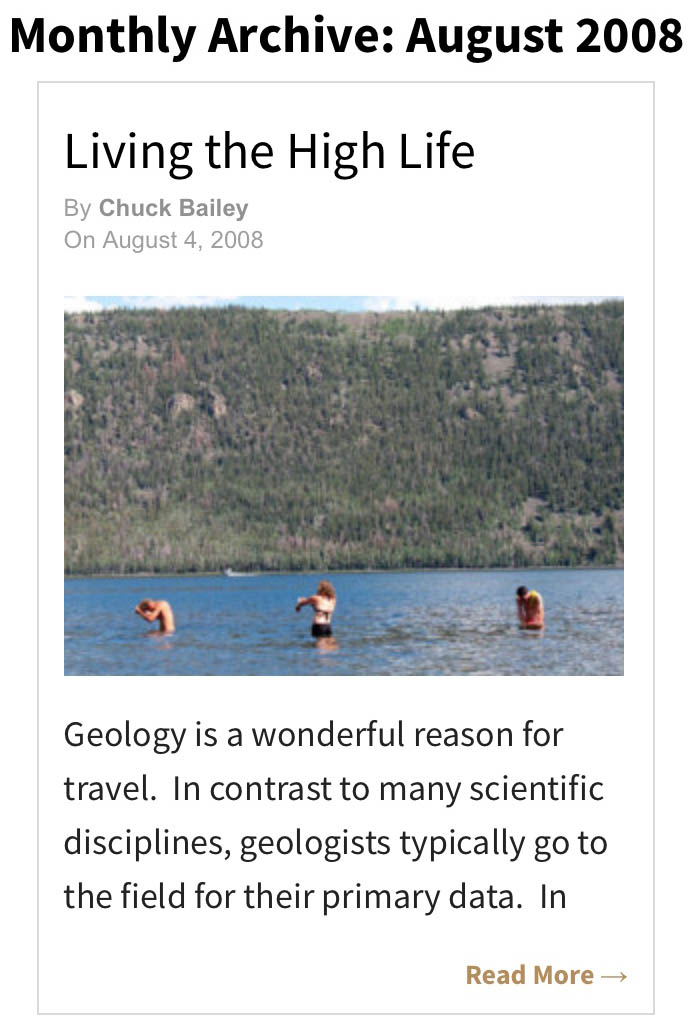 On August 4th, 2008, I published my first post on William & Mary Blogs, Living the High Life chronicled that summer’s field research with a crew of William & Mary geologists on Utah’s High Plateaus. 10-years have come-and-gone – yikes!
My 10th blog post dropped on Charter Day 2009, the 50th rolled out just before Convocation at the start of the fall semester in 2012, and the 100th wrapped up the end of the academic year in 2016.
Over the past decade I’ve written 129 posts for W&M Blogs. This all started as W&M redesigned its entire web presence in 2008, and launched William & Mary Blogs – which would offer insight on William & Mary through the eyes of those who study, teach, and work here. It was an admirable goal in 2008, and I think it still has merit.
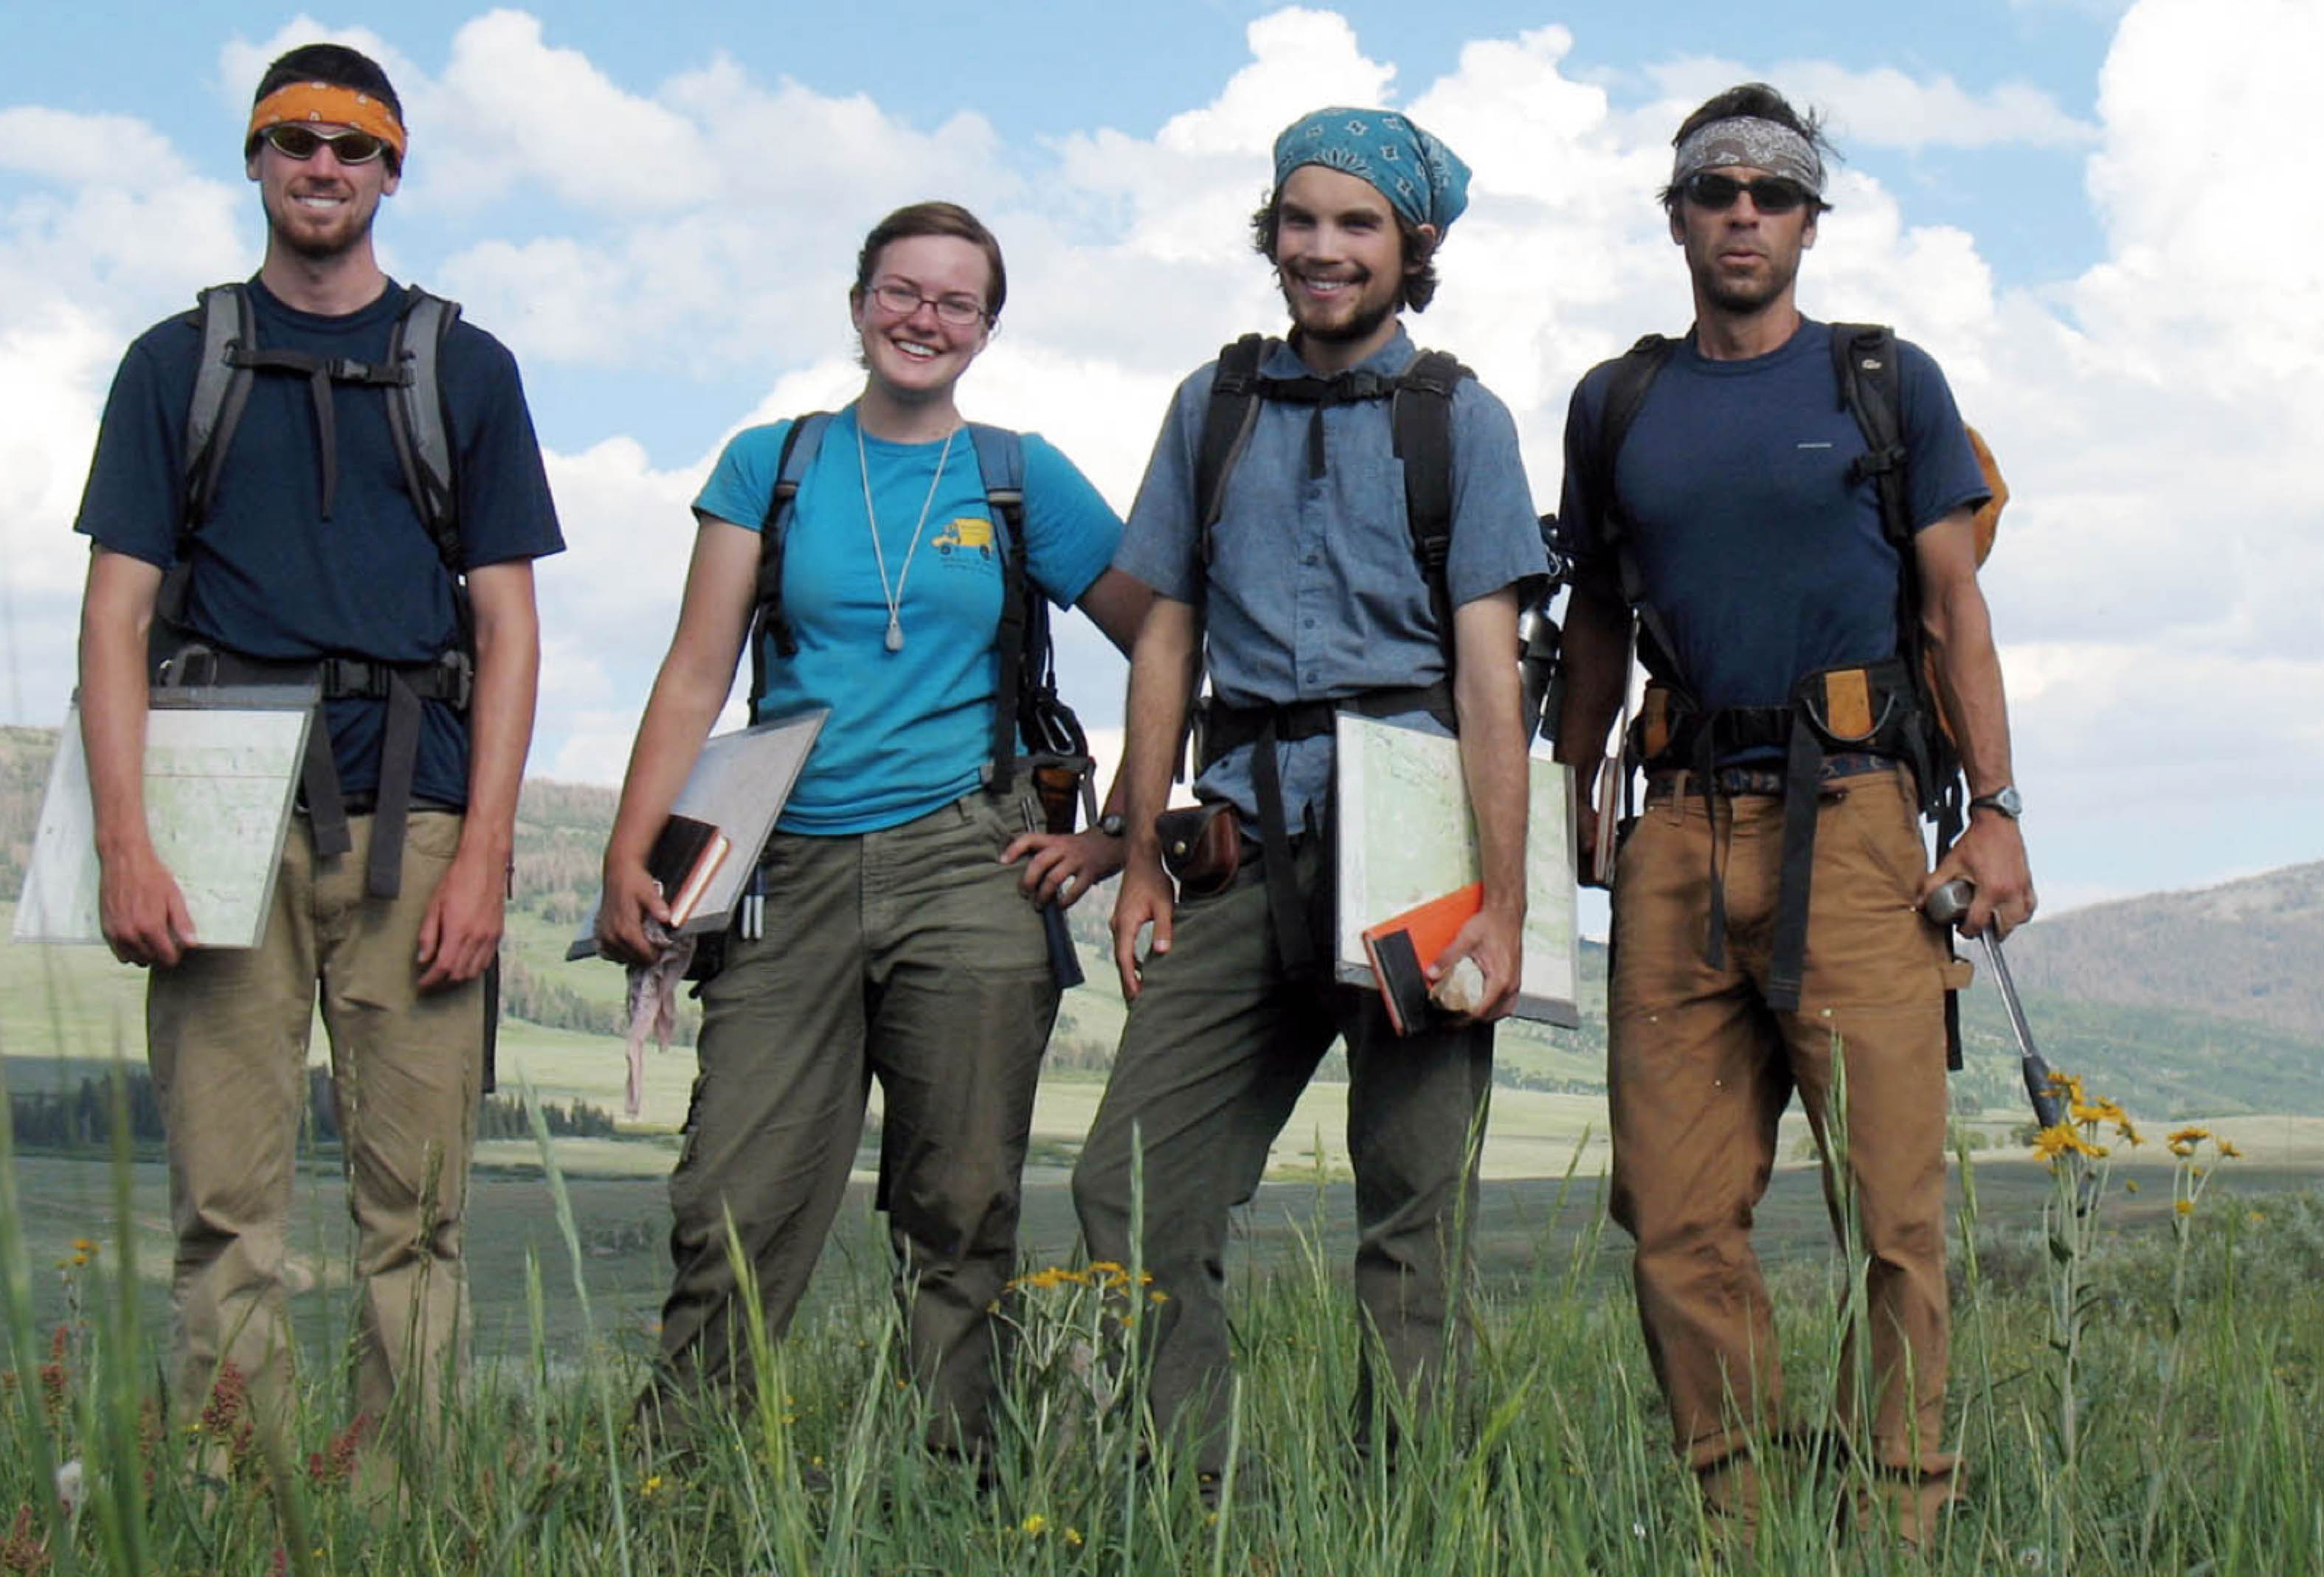
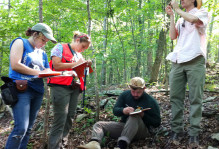
William & Mary geologists strike a pose after a long day of field work on the Fish Lake Plateau, Utah in the summer of 2008. From left to right: Graham Lederer, JoBeth Carbaugh, Trevor Buckley, and Chuck Bailey.
The long-running joke with my research students is “Chuck, you have a blog? Hmm… I didn’t know that.” Neither my mother or my wife read the blog, and some of my faculty colleagues are patiently embarrassed that, as a faculty member, I’d stoop so low as to write a blog. I’ve been asked by W&M leaders to write specific posts promoting W&M, but I’m confident that administrators are far too busy to actually click on a link, much less read a post from start to finish. Nonetheless, I’ve carried on for a decade now.
My overarching goal is to convey a sense of what it’s like to study the Earth here in the W&M Geology department – we’ve got a special community that’s worth telling the world about. In the past five years, I’ve increasingly used the blog to weave specific content into my courses; content that is nowhere to be found in textbooks or journal articles. But I’m not sure whether my students actually read assigned posts or just look at the pictures!
129 posts in 10-years comes out to a tad more than one post per month over the long haul. The column graph below shows the number published per calendar year. 2013 yielded only 7 posts, but 2014 had a bumper crop of 20 posts. What’s the cause of this year-to-year variability? I’ve published the most posts during the month of October (14), with January and August as close runner-ups (13). June is my least productive month for blog posts (5), which is nearly half the next lowest month’s output. What’s the reason for this month-to-month variability? Curiously, over the years, three posts were published on March 13th, but I’ve only published on the 1st day of the month once (that was in April, and it’s a good read).
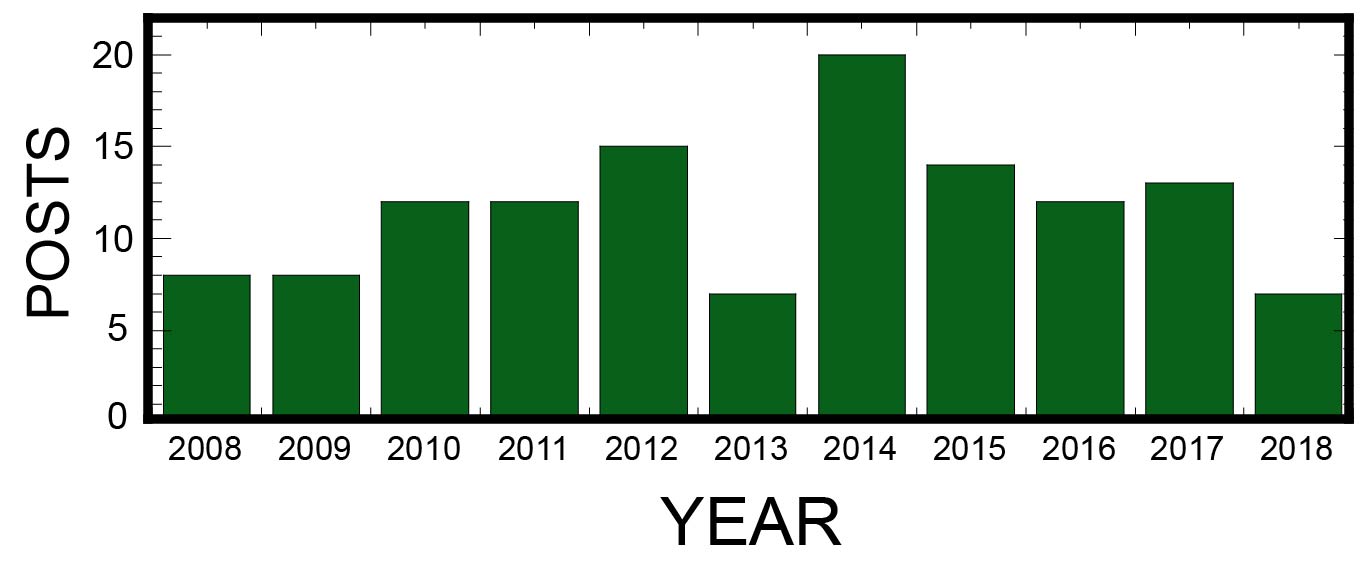
Number of Chuck Bailey blog posts per year on William & Mary Blogs.
A decade’s worth of blog posts can easily be framed as a way to consider time series data. Scientists who study change in natural systems are always concerned with time series data. In the humanities and social sciences, studies that incorporate time series data are known as longitudinal studies (although there are typically differences in the methodology).
Over the past five years, I’ve taught a COLL 100 course focused on Weather, Climate, & Change – considering time series data are a big part of what we study. Time series data are the empirical foundation for understanding climate change, which will be one of humanities’ great challenges in the coming century. Time series data are easily presented in graphical form, but not every graph is equally useful.
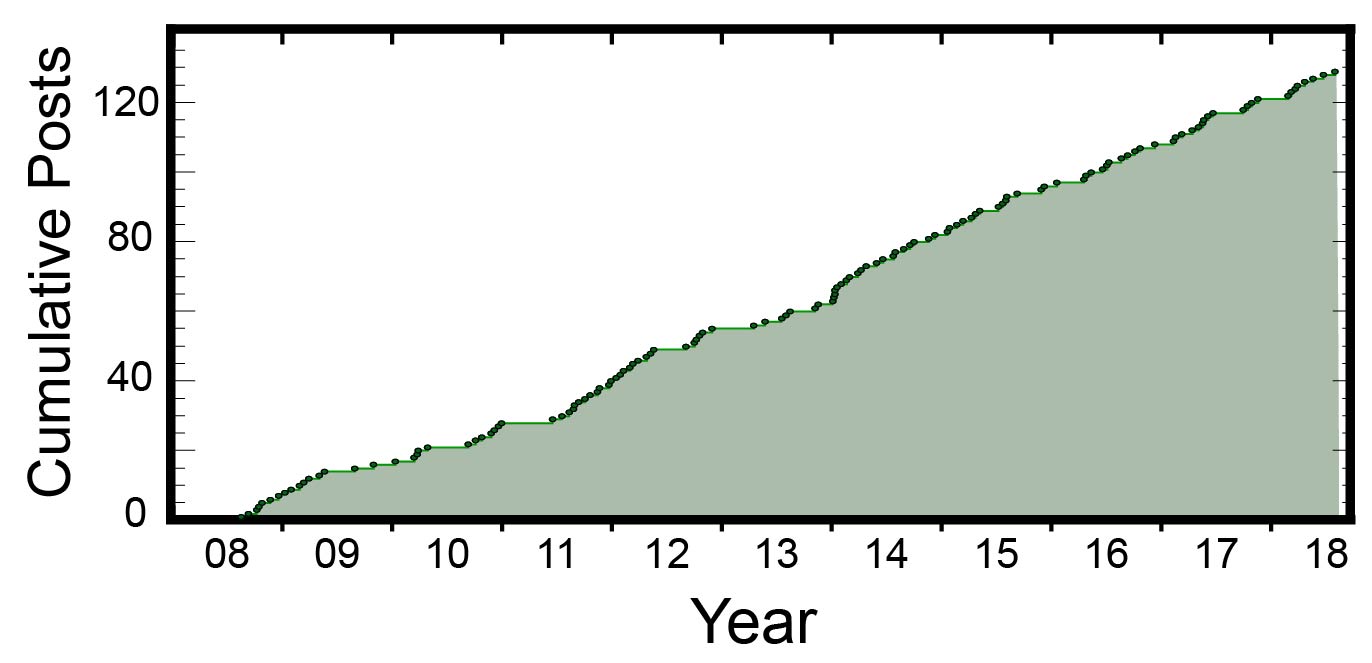
Cumulative time graph of Chuck’s blog posts (2008 – 2018). The flat/horizontal line segments are times with no blog posts :(. Over the long-haul, the rate of blogs/year is approximately linear. Graphs of this type are useful for illustrating how and when a quantity accrues over time (e.g. precipitation during the course of the year).
Let’s increase our data for that same time frame to include all the posts published on William & Mary Blogs. The inimitable Joe McClain wrote the first W&M blog post, it hatched on February 1st 2008. Since then 3,225 posts have been launched into the blogosphere.
Do W&M blogs occur with equal frequency throughout the year? Are there systematic changes happening to W&M blogs over time? These questions can be addressed with a graphical approach.
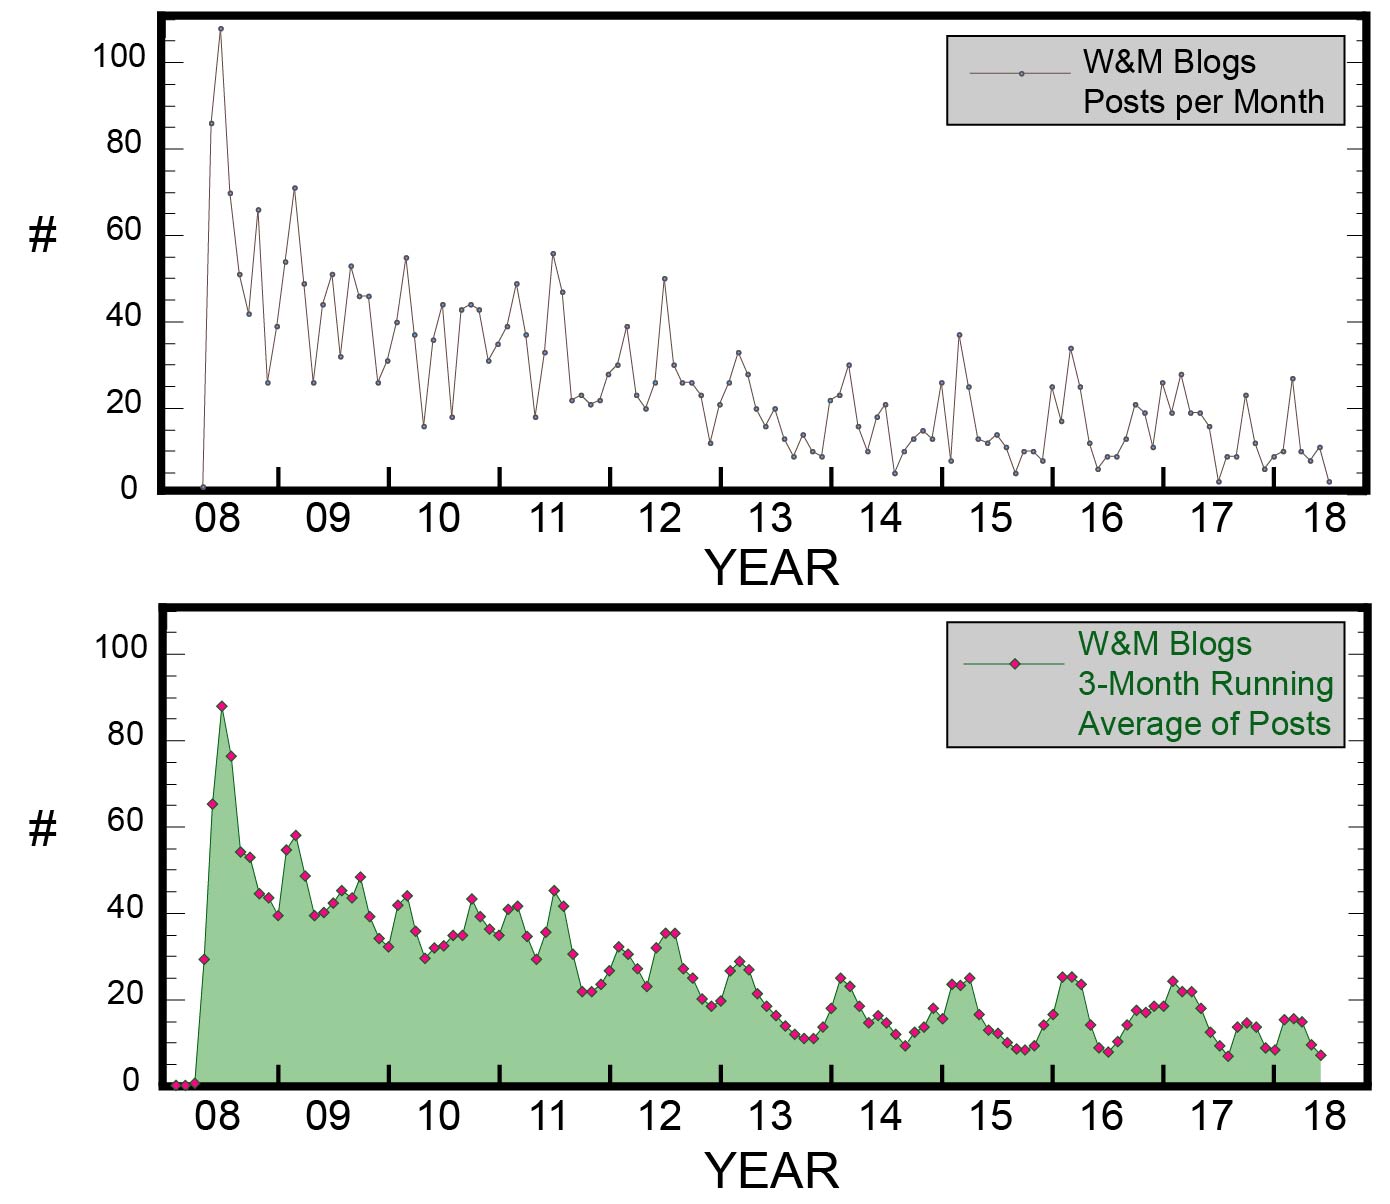
Two time series graphs of William & Mary Blogs (2008 to 2018). Which graph is the most winsome? Which graph is the most informative?
Clear trends are evident, and discernible at nearly any scale that one chooses to parse the data (monthly, seasonally with a 3-month running average, or annually). The month-to-month plot is spiky with lots of variability from month to month, whereas the 3-month running average yields a smoother trend in which a cyclic pattern emerges. Is there a seasonality to blog posting at William & Mary – maybe blog posts are more related to weather and climate than one would think.

William & Mary blogs per year (2008-2018) with linear and exponential lines of best-fit.
The number W&M Blogs posts have dropped from nearly the outset of this endeavor; in 2009 ~550 posts were crafted while in 2018 less than 150 will likely occur*. Is there a linear decline in W&M Blogs posts? The best-fit line to these data has a correlation coefficient (R2) of 0.86, that is a strong relationship. However, a quick visual inspection of the data points reveals a broad concave-up shape that is better approximated by an exponential best-fit line with a larger correlation coefficient (R2 = 0.94).
A number of factors are responsible for this decline. There is a ‘lifespan’ to media, which are first introduced and grow in popularity, but ultimately follow some form of exponential decay into oblivion (8-track tapes, and newspapers printed on paper are examples). Blog posts had their day, and are now on the decline as other media have blossomed. The smart phone revolution with the linked growth of Twitter, Instagram, Snapchat, Etc. brought about much of this change.
The Revolution will not be televised, but you’ll receive a Snap about it!
Why read a blog post when you can get all the info you need in a ≤280-character tweet?
Times change. A decade ago, William & Mary students reliably checked their email accounts. Today, W&M faculty regularly remind students to check their email accounts. If I wish to quickly communicate with my research students, I send them a Snapchat.
My blog-productivity has been nearly linear for the past decade, while during that same interval the number of W&M Blogs posts has gradually waned. I suspect W&M Blogs won’t be around ten years from now.
For the moment I’ll carry on, as blogging allows me to provide high-density content and visuals that are accessible to a broad audience far beyond William & Mary. If I were more ambitious, I’d integrate and promote these posts through the many tendrils of social media. Perhaps that day will come!
It’s been a fun decade of framing up stories about our academic adventures here on Earth and beyond.
* as of August 2nd there have been 79 W&M Blogs posts in 2018, I projected the number forward to estimate the total for all of 2018.


Comments are currently closed. Comments are closed on all posts older than one year, and for those in our archive.
I did a spit take when I saw that you have to remind students to check their email, and that you use snapchat to get in touch with them quickly. I am totally flabbergasted and apparently super old.
On another note, I really enjoy your blogging, so keep it up!
Thanks for being one of the few consistent faculty bloggers! I skim them and look at the pictures so keep including graphs and photos.
Sometimes we don’t realize the impact we have until many years later. Keep up the good work!
Ah, Chuck , I remember when you adopted SnapChat, which reluctance, as did I. I still read these and enjoy them. You certainly do chronicle awesome places of geologic interest. Maybe you should look into making some aerial-cinematic accompaniments to them as well (see this: https://www.youtube.com/channel/UCsFlw1_ViywLuzj6NK_HDrQ). Blog about the geology and show it! That would be super cool. Until you quit writing these, I’ll keep reading them.
If those clipboards you invented have been around since 2008, no wonder the duct tape is wearing off…although the colorful duct tape now is more fun. Also, your current lime-green shirt and red bandana combo is more eye-catching than this navy blue shirt and gray bandana, just saying.