
Frost on the Pumpkin
Fall has reached its full crescendo in Williamsburg; leaves are a riot of orange, scarlet and russet, the temperature has dropped, and frost has been sighted on more than a few pumpkins. The National Weather Service has officially declared the 2011 growing season over. The growing season ends when the first freeze occurs (i.e. the air temperature drops to or below 0˚ C).
The Weather, Climate, and Change class has taken a close look at the first freeze dates for Williamsburg. The histogram below is a time series, with 111 years of records from 1900 to 2011, that illustrates the first freeze date in Williamsburg for a given year. The earliest date for a frost was October 2nd (which occurred in both 1946 and 1947) and the latest frost occurred on December 1st (in 2009), the mean date for the first frost is just about November 1st. Are any trends evident from the time series?
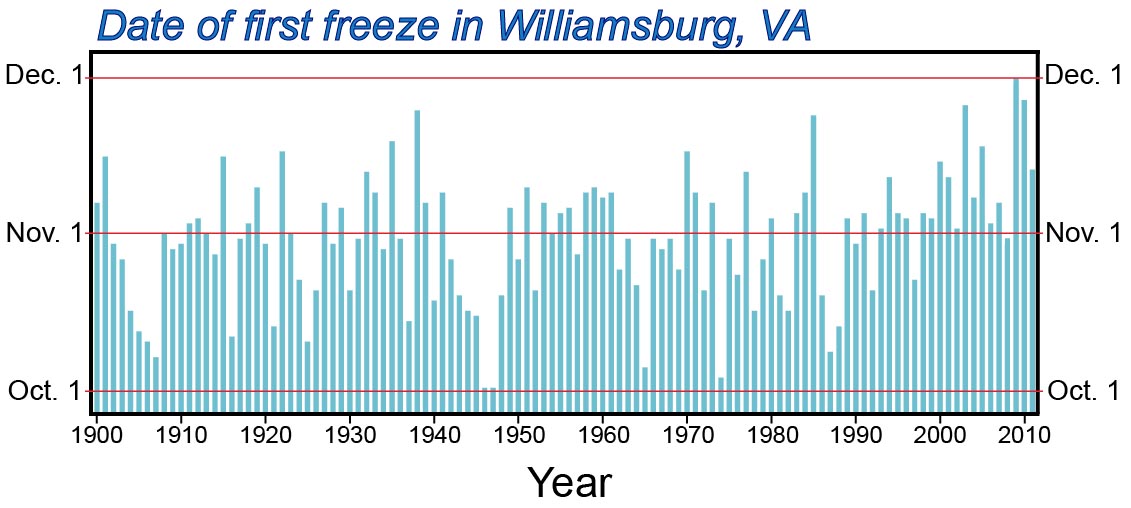
Over the last 111 years Williamsburg’s first freeze occurred with equal frequency in October and November, but in the recent past the first freeze almost always occurs in November. Only once in the past 14 years did the first frost occur earlier than November 1st. What, if anything, might this mean?
Growing season, the time between the last frost in the spring and the first frost in the fall, is an important metric of a locale’s climate. In Williamsburg the mean growing season is an ample 203 days, but has varied between 156 days (in 1946) and 263 days (in 2010). The plot below is the revered (or is that reviled?) scatter plot; each orange diamond illustrates the growing season for a particular year. Do any patterns or trends jump from the graph?
Animated scatter plot of Williamsburg growing season data.
The variation from year to year is significant and makes discerning any temporal patterns difficult. When in doubt it’s always fun to fit a line to a data set. With a few clicks of the mouse I ran a linear regression and produced a best-fit line for the data. The best-fit line has a gentle positive slope (0.146), indicating that the growing season in Williamsburg has increased over time. According to the regression, the growing season is increasing by ~1.5 days per decade (just over two weeks in a century). But the correlation coefficient (R2) for the best-fit line is quite low (0.06), an expected result given the wide variation in growing season length from one year to the next. Many people may understandably be skeptical of this trend.
Another way to consider these data is to take a five-year running average (incorporating the 2 previous years and 2 following years as well). This produces a smoothing effect that reduces the overall variation in growing season length. My eye is drawn to a dip in growing season in the mid-1940s and the perceptible lengthening of the growing season starting in the 1990s.
For many people the decade-scale is a handy interval in which to categorize time (e.g. the Roaring 20s, the Swinging 60s, etc.). Consider Williamsburg’s growing season averaged by decade. The 1940s take the prize for shortest mean growing season (185 days) while the 2000s come in with the longest (225 days). The thin black lines and bars (whiskers) extending above and below individual data points are a standard deviation: the longer the whisker the greater the variation.
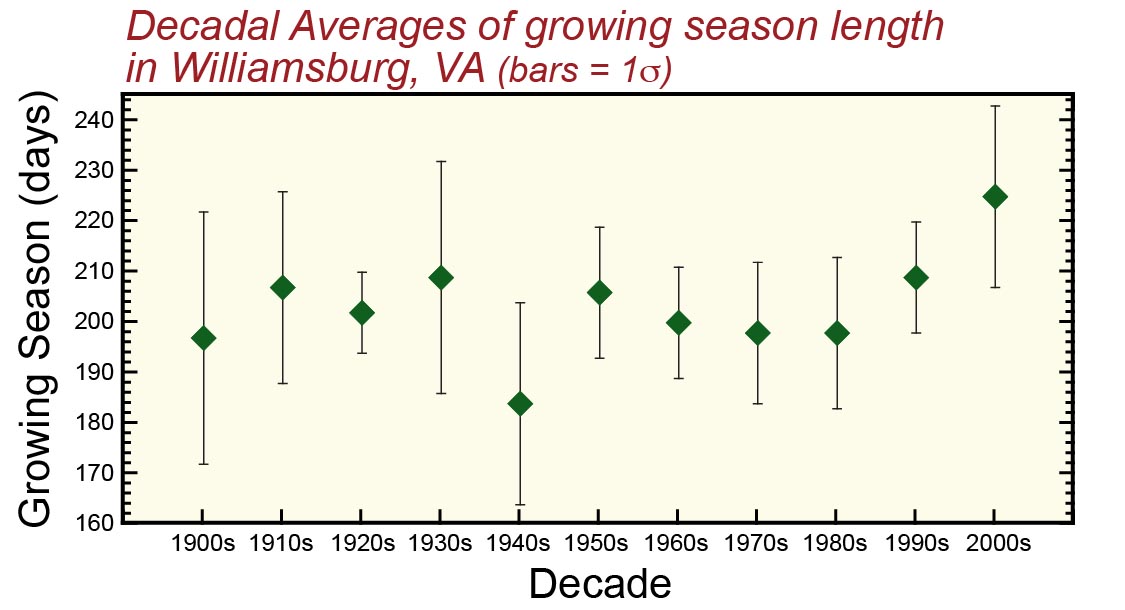
Here’s the question I put to the students: is there a significant difference between decadal growing seasons? The standard deviations between the 1940s and 2000s don’t overlap; we can reasonably conclude that the growing season is significantly different between these decades. There is much overlap between the standard deviations in the other decades. Can we make sense of these data? Are the trends real or significant? My Weather, Climate, and Change students debated all of this.
It was a contentious debate because time series data can be complex and teasing out patterns is not trivial. But consider this: since the start of the 21st century the shortest growing season in Williamsburg has been 207 days, during the 30 year interval between 1960 and 1989 only six years (20%) had growing seasons as long as 207 days. Five of the Top Ten longest growing seasons occurred in the last decade. Since the 1980s, Williamsburg’s growing season is about 3 weeks longer than it was in the 1980s, the last frost in spring generally comes earlier and the first frost in fall arrives later. We could have an early frost next year and a short growing season, but the trend towards longer growing seasons is clear.
What the class hasn’t debated yet is just what could be causing these longer growing seasons. Is it global warming, an urban heat island effect, or maybe a decadal-scale climate oscillation? But let’s not get ahead of ourselves! Our discussion on the driving processes comes next…

No comments.
Comments are currently closed. Comments are closed on all posts older than one year, and for those in our archive.